Nordstrom 2015 Annual Report Download - page 63
Download and view the complete annual report
Please find page 63 of the 2015 Nordstrom annual report below. You can navigate through the pages in the report by either clicking on the pages listed below, or by using the keyword search tool below to find specific information within the annual report.-
 1
1 -
2
-
3
-
4
-
5
-
6
-
7
-
8
-
9
-
10
-
11
-
12
-
13
-
14
-
15
-
16
-
17
-
18
-
19
-
20
-
21
-
22
-
23
-
24
-
25
-
26
-
27
-
28
-
29
-
30
-
31
-
32
-
33
-
34
-
35
-
36
-
37
-
38
-
39
-
40
-
41
-
42
-
43
-
44
-
45
-
46
-
47
-
48
-
49
-
50
-
51
-
52
-
 53
53 -
 54
54 -
 55
55 -
 56
56 -
 57
57 -
 58
58 -
 59
59 -
 60
60 -
 61
61 -
 62
62 -
 63
63 -
 64
64 -
 65
65 -
 66
66 -
 67
67 -
 68
68 -
 69
69 -
 70
70 -
 71
71 -
 72
72 -
 73
73 -
74
-
75
-
76
-
77
 |
 |
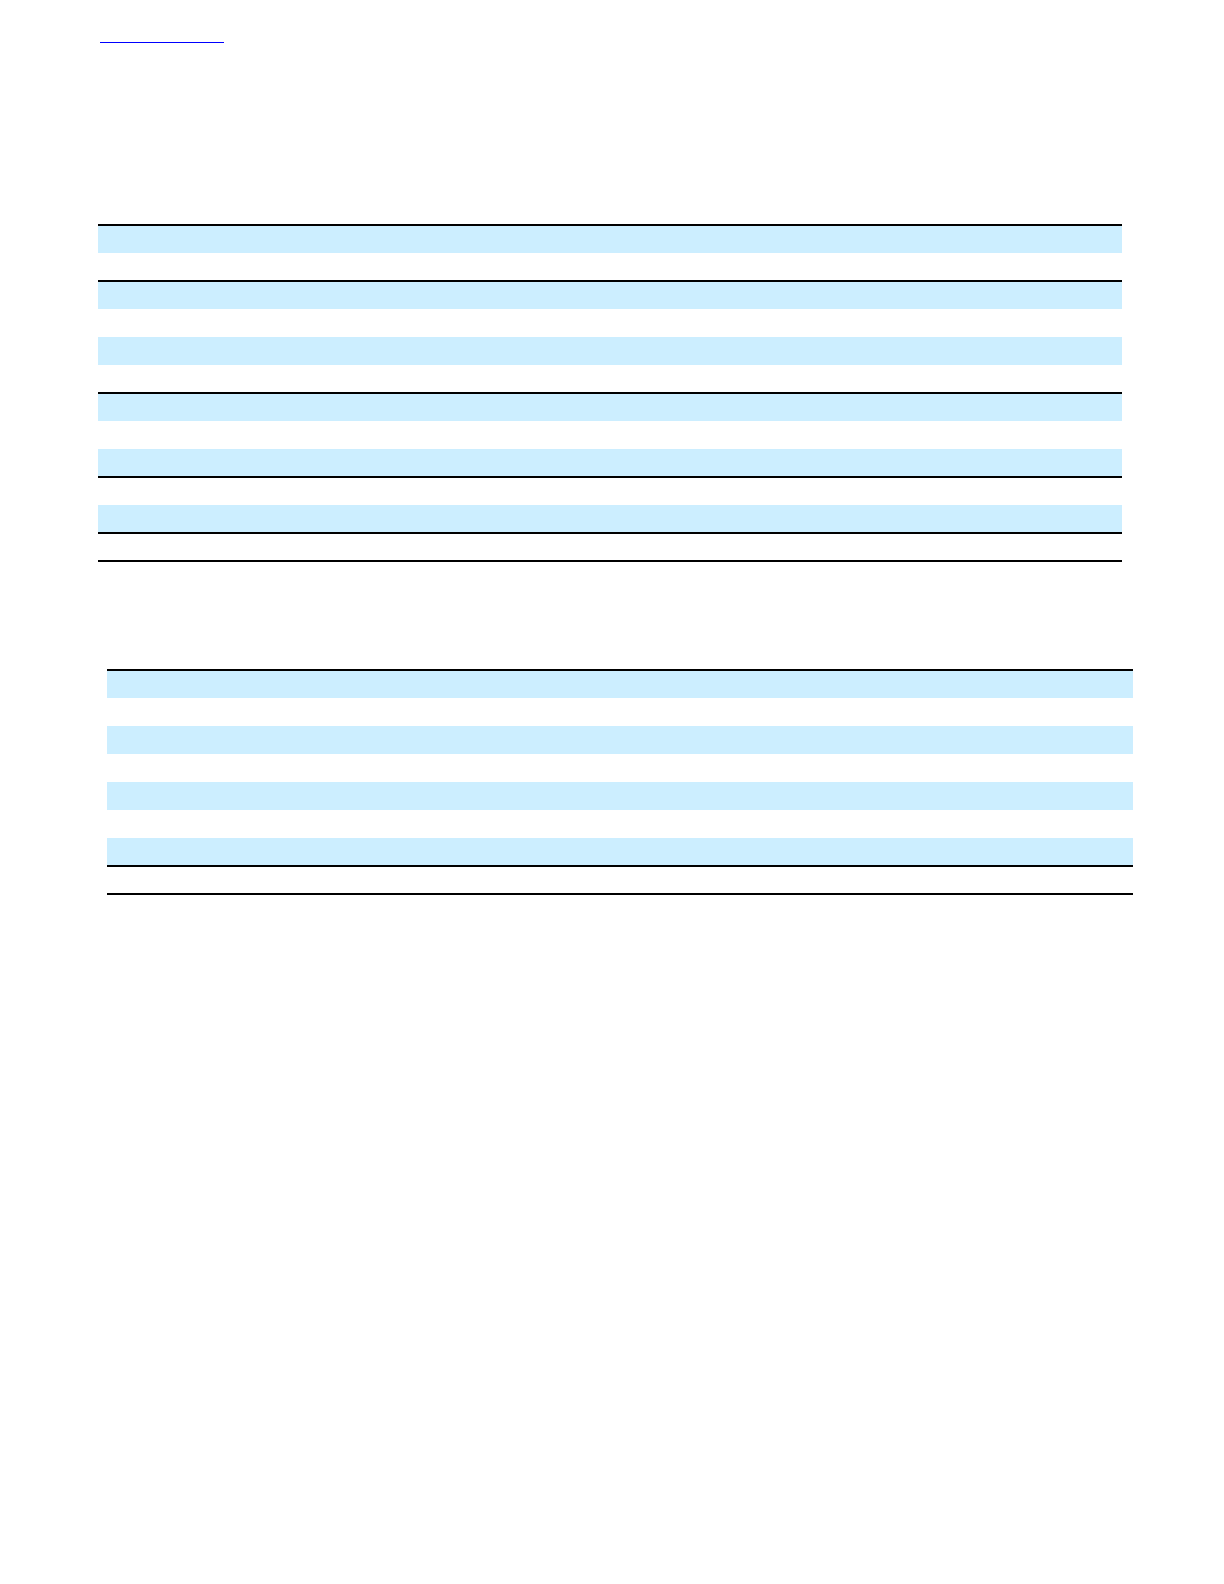
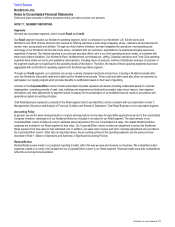
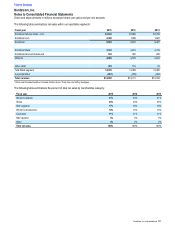
The following table summarizes net sales within our reportable segments:
Fiscal year 2015 2014 2013
Nordstrom full-line stores - U.S. $7,633 $7,682 $7,705
Nordstrom.com 2,300 1,996 1,622
Nordstrom 9,933 9,678 9,327
Nordstrom Rack 3,533 3,215 2,738
Nordstromrack.com/HauteLook 532 360 295
Off-price 4,065 3,575 3,033
Other retail1378 116 35
Total Retail segment 14,376 13,369 12,395
Corporate/Other (281)(259)(229)
Total net sales $14,095 $13,110 $12,166
1 Other retail includes Nordstrom Canada full-line stores, Trunk Club and Jeffrey boutiques.
The following table summarizes the percent of total net sales by merchandise category:
Fiscal year 2015 2014 2013
Women€s Apparel 31%30%31%
Shoes 23%23%23%
Men€s Apparel 17%16%16%
Women€s Accessories 12%14%14%
Cosmetics 11%11%11%
Kids€ Apparel 3%4%3%
Other 3%2%2%
Total net sales 100%100%100%
Table of Contents
Nordstrom, Inc.
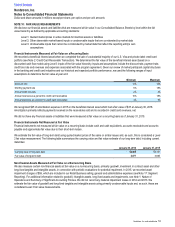
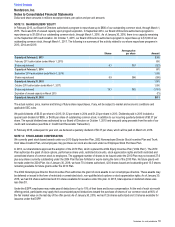
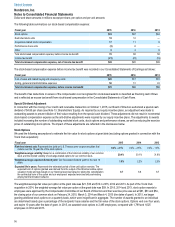
Notes to Consolidated Financial Statements
Dollar and share amounts in millions except per share, per option and per unit amounts
Nordstrom, Inc. and subsidiaries 63