Nordstrom 2015 Annual Report Download - page 16
Download and view the complete annual report
Please find page 16 of the 2015 Nordstrom annual report below. You can navigate through the pages in the report by either clicking on the pages listed below, or by using the keyword search tool below to find specific information within the annual report.-
 1
1 -
2
-
3
-
4
-
5
-
 6
6 -
 7
7 -
 8
8 -
 9
9 -
 10
10 -
 11
11 -
 12
12 -
 13
13 -
 14
14 -
 15
15 -
 16
16 -
 17
17 -
 18
18 -
 19
19 -
 20
20 -
 21
21 -
 22
22 -
 23
23 -
 24
24 -
 25
25 -
 26
26 -
27
-
28
-
29
-
30
-
31
-
32
-
33
-
34
-
35
-
36
-
37
-
38
-
39
-
40
-
41
-
42
-
43
-
44
-
45
-
46
-
47
-
48
-
49
-
50
-
51
-
52
-
53
-
54
-
55
-
56
-
57
-
58
-
59
-
60
-
61
-
62
-
63
-
64
-
65
-
66
-
67
-
68
-
69
-
70
-
71
-
72
-
73
-
74
-
75
-
76
-
77
 |
 |

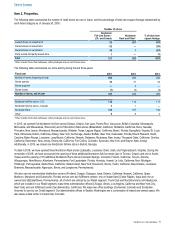
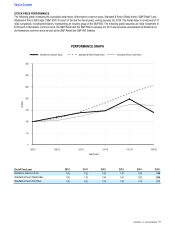
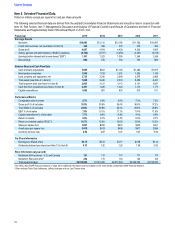
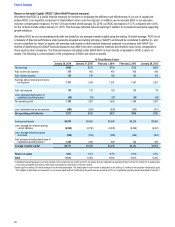
Item€6. Selected Financial Data.
Dollars in millions except per square foot and per share amounts
The following selected financial data are derived from the audited Consolidated Financial Statements and should be read in conjunction with
Item•1A: Risk Factors, Item•7: Management€s Discussion and Analysis of Financial Condition and Results of Operations and Item•8: Financial
Statements and Supplementary Data of this Annual Report on Form 10-K.
Fiscal year 2015 2014 2013 2012 2011
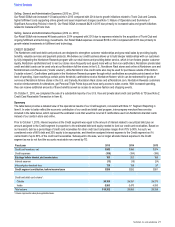
Earnings Results
Net sales $14,095 $13,110 $12,166 $11,762 $10,497
Credit card revenues, net (see Note 2 in Item 8) 342 396 374 372 363
Gross profit 4,927 4,704 4,429 4,330 3,905
Selling, general and administrative (‚SG&Aƒ) expenses (4,168) (3,777) (3,453) (3,357) (3,019)
Earnings before interest and income taxes (‚EBITƒ) 1,101 1,323 1,350 1,345 1,249
Net earnings 600 720 734 735 683
Balance Sheet and Cash Flow Data
Cash and cash equivalents $595 $827 $1,194 $1,285 $1,877
Merchandise inventories 1,945 1,733 1,531 1,360 1,148
Land, property and equipment, net 3,735 3,340 2,949 2,579 2,469
Total assets (see Note 2 in Item 8) 7,698 9,245 8,574 8,089 8,491
Total long-term debt (see Note 9 in Item 8) 2,805 3,131 3,113 3,131 3,647
Cash flow from operations (see Note 2 in Item 8) 2,451 1,220 1,320 1,110 1,177
Capital expenditures 1,082 861 803 513 511
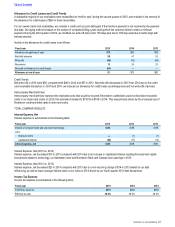
Performance Metrics
Comparable sales increase 2.7%4.0%2.5%7.3%7.2%
Gross profit % of net sales 35.0% 35.9% 36.4% 36.8% 37.2%
Total SG&A % of net sales 29.6% 28.8% 28.4% 28.5% 28.8%
EBIT % of net sales 7.8% 10.1% 11.1% 11.4% 11.9%
Capital expenditures % of net sales 7.7% 6.6% 6.6% 4.4% 4.9%
Return on assets 6.6% 8.1% 8.7% 8.9% 8.7%
Return on invested capital (‚ROICƒ)110.7% 12.6% 13.6% 13.9% 13.3%
Sales per square foot $507 $493 $474 $470 $431
4-wall sales per square foot $410 $413 $408 $417 $394
Inventory turnover rate 4.54 4.67 5.07 5.37 5.56
Per Share Information
Earnings per diluted share $3.15 $3.72 $3.71 $3.56 $3.14
Dividends declared per share (see Note 13 in Item 8) 6.33 1.32 1.20 1.08 0.92
Store Information (at year-end)
Nordstrom full-line stores - U.S. and Canada 121 117 117 117 117
Nordstrom Rack and other2202 175 143 123 108
Total square footage 28,610,000 27,061,000 26,017,000 25,290,000 24,745,000
1 See ROIC (Non-GAAP financial measure) on page 26 for additional information and reconciliation to the most directly comparable GAAP financial measure.
2 Other includes Trunk Club clubhouses, Jeffrey boutiques and our Last Chance store.
Table of Contents
16