Nordstrom 2015 Annual Report Download - page 20
Download and view the complete annual report
Please find page 20 of the 2015 Nordstrom annual report below. You can navigate through the pages in the report by either clicking on the pages listed below, or by using the keyword search tool below to find specific information within the annual report.-
 1
1 -
2
-
3
-
4
-
5
-
6
-
7
-
8
-
9
-
 10
10 -
 11
11 -
 12
12 -
 13
13 -
 14
14 -
 15
15 -
 16
16 -
 17
17 -
 18
18 -
 19
19 -
 20
20 -
 21
21 -
 22
22 -
 23
23 -
 24
24 -
 25
25 -
 26
26 -
 27
27 -
 28
28 -
 29
29 -
 30
30 -
31
-
32
-
33
-
34
-
35
-
36
-
37
-
38
-
39
-
40
-
41
-
42
-
43
-
44
-
45
-
46
-
47
-
48
-
49
-
50
-
51
-
52
-
53
-
54
-
55
-
56
-
57
-
58
-
59
-
60
-
61
-
62
-
63
-
64
-
65
-
66
-
67
-
68
-
69
-
70
-
71
-
72
-
73
-
74
-
75
-
76
-
77
 |
 |

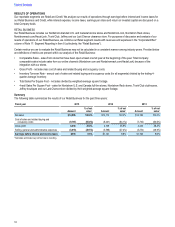
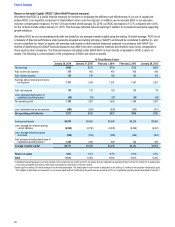
Within our off-price offering, Nordstrom Rack net sales increased 9.9%, compared with 2014, reflecting the accelerated expansion of new
stores. Comparable sales decreased 1.0% for the year. Shoes and Cosmetics were the top-performing categories, while the South was the
top-performing geographic region. Nordstrom Rack experienced an increase in the average retail price per item sold offset by a decrease in
the total number of items sold. Sales per square foot of Nordstrom Rack decreased due to store expansion.
Nordstromrack.com/HauteLook experienced outsized growth, with a net sales increase of 47%.
Net Sales (2014 vs. 2013)
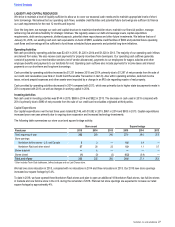
Total Company net sales for 2014 increased 7.8% compared with 2013, which was attributable to a comparable sales increase of 4.0%.
During 2014, we opened three Nordstrom full-line stores, including our first store in Canada, 27 Nordstrom Rack stores and acquired Trunk
Club. These additions represented 2.8% of our total net sales for 2014 and increased our square footage by 5.5%.
Full-price net sales for 2014 increased 3.8% compared with 2013, with comparable sales up 3.6%. These increases were largely due to the
performance of our Nordstrom.com channel. Both the number of items sold and the average selling price increased on a comparable basis in
2014 compared with 2013. Category leaders included Accessories, Cosmetics and Men€s Apparel.
U.S. full-line store net sales for 2014 decreased 0.3% compared with 2013, which was primarily driven by a decrease in comparable sales.
The top-performing geographic regions for 2014 were the Southeast and Southwest.
Our Nordstrom.com and Nordstromrack.com/HauteLook channels experienced outsized growth, with a net sales increase of 23% at
Nordstrom.com and 22% at Nordstromrack.com/HauteLook compared with 2013. These increases were driven by both expanded
merchandise selection and ongoing technology investments to enhance the customer experience.
Nordstrom Rack net sales increased 17% compared with 2013, reflecting incremental volume from existing stores and the impact of new
store openings. On a comparable basis, the average selling price of Nordstrom Rack merchandise increased while the number of items sold
was flat. Shoes and Accessories were the strongest-performing categories for 2014.
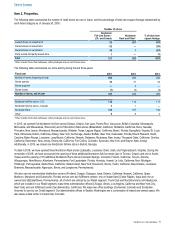
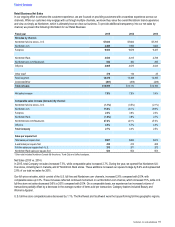
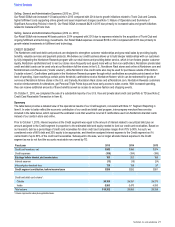
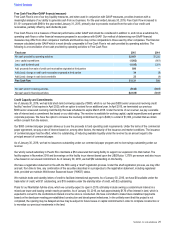
Retail Business Gross Profit
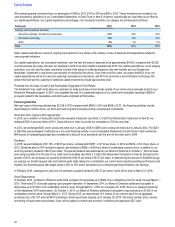
The following table summarizes the Retail Business gross profit:
Fiscal year 2015 2014 2013
Retail gross profit $4,934 $4,709 $4,434
Retail gross profit as a % of net sales 35.0%35.9%36.4%
Ending inventory per square foot $67.97 $64.05 $58.84
Inventory turnover rate 4.54 4.67 5.07
Gross Profit (2015 vs. 2014)
Our Retail gross profit rate decreased 92 basis points compared with 2014 primarily due to higher cost of sales driven by increased
markdowns from lower than planned sales and in response to an elevated promotional environment during the second half of the year. Retail
gross profit increased $225 in 2015 due to an increase in net sales, partially offset by increased markdowns.
Our inventory turnover rate decreased to 4.54 in 2015, from 4.67 in 2014, due to softer sales trends experienced during the second half of
the year. Our ending inventory per square foot increased 6.1% in 2015, which outpaced our sales per square foot increase of 2.9%. As we
continue to grow our online channels, we expect increases in inventory without corresponding increases in square footage.
Gross Profit (2014 vs. 2013)
Our Retail gross profit rate decreased 52 basis points compared with 2013 primarily due to increased markdowns and Nordstrom Rack€s
accelerated store expansion. Retail gross profit increased $275 in 2014 compared with 2013 due to an increase in net sales, partially offset
by increased markdowns.
Our inventory turnover rate decreased in 2014 and our ending inventory per square foot increased 8.8%. This increase in ending inventory
per square foot outpaced our increase in sales per square foot of 3.9% primarily due to planned inventory growth related to Nordstrom Rack
and Nordstromrack.com/HauteLook.
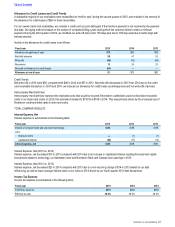
Retail Business Selling, General and Administrative Expenses
Retail Business selling, general and administrative expenses (‚Retail SG&Aƒ) are summarized in the following table:
Fiscal year 2015 2014 2013
Selling, general and administrative expenses $4,016 $3,588 $3,272
Selling, general and administrative expenses as a % of net sales 28.5%27.4%26.9%
Table of Contents
20