Nordstrom 2015 Annual Report Download - page 19
Download and view the complete annual report
Please find page 19 of the 2015 Nordstrom annual report below. You can navigate through the pages in the report by either clicking on the pages listed below, or by using the keyword search tool below to find specific information within the annual report.-
 1
1 -
2
-
3
-
4
-
5
-
6
-
7
-
8
-
 9
9 -
 10
10 -
 11
11 -
 12
12 -
 13
13 -
 14
14 -
 15
15 -
 16
16 -
 17
17 -
 18
18 -
 19
19 -
 20
20 -
 21
21 -
 22
22 -
 23
23 -
 24
24 -
 25
25 -
 26
26 -
 27
27 -
 28
28 -
 29
29 -
30
-
31
-
32
-
33
-
34
-
35
-
36
-
37
-
38
-
39
-
40
-
41
-
42
-
43
-
44
-
45
-
46
-
47
-
48
-
49
-
50
-
51
-
52
-
53
-
54
-
55
-
56
-
57
-
58
-
59
-
60
-
61
-
62
-
63
-
64
-
65
-
66
-
67
-
68
-
69
-
70
-
71
-
72
-
73
-
74
-
75
-
76
-
77
 |
 |

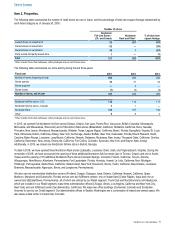
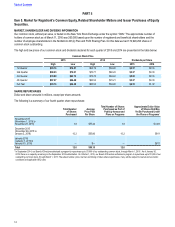
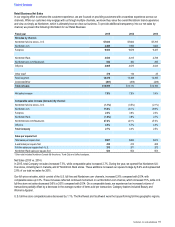
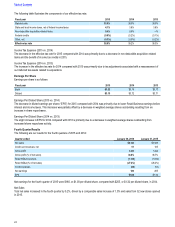
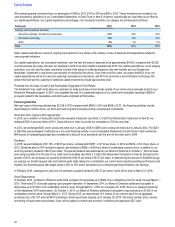
Retail Business Net Sales
In our ongoing effort to enhance the customer experience, we are focused on providing customers with a seamless experience across our
channels. While our customers may engage with us through multiple channels, we know they value the overall Nordstrom brand experience
and view us simply as Nordstrom, which is ultimately how we view our business. To provide additional transparency into our net sales by
channel, we present the following information for our Retail Business:
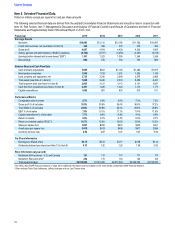
Fiscal year 2015 2014 2013
Net sales by channel:
Nordstrom full-line stores - U.S. $7,633 $7,682 $7,705
Nordstrom.com 2,300 1,996 1,622
Full-price 9,933 9,678 9,327
Nordstrom Rack 3,533 3,215 2,738
Nordstromrack.com/HauteLook 532 360 295
Off-price 4,065 3,575 3,033
Other retail1378 116 35
Retail segment 14,376 13,369 12,395
Corporate/Other (281)(259)(229)
Total net sales $14,095 $13,110 $12,166
Net sales increase 7.5%7.8%3.4%
Comparable sales increase (decrease) by channel:
Nordstrom full-line stores - U.S. (1.1%) (0.5%) (2.1%)
Nordstrom.com 15.2%23.1%29.5%
Full-price 2.3%3.6%2.3%
Nordstrom Rack (1.0%) 3.8%2.7%
Nordstromrack.com/HauteLook 47.4%22.1%27.3%
Off-price 4.3%5.7%4.9%
Total Company 2.7%4.0%2.5%
Sales per square foot:
Total sales per square foot $507 $493 $474
4-wall sales per square foot 410 413 408
Full-line sales per square foot - U.S. 370 371 372
Nordstrom Rack sales per square foot 523 552 553
1 Other retail includes Nordstrom Canada full-line stores, Trunk Club and Jeffrey boutiques.
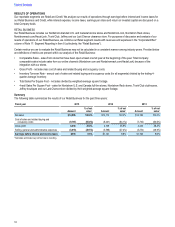
Net Sales (2015 vs. 2014)
In 2015, total Company net sales increased 7.5%, while comparable sales increased 2.7%. During the year, we opened five Nordstrom full-
line stores, including two in Canada, and 27 Nordstrom Rack stores. These additions increased our square footage by 6.4% and represented
2.8% of our total net sales for 2015.
Our full-price net sales, which consist of the U.S. full-line and Nordstrom.com channels, increased 2.6% compared with 2014, with
comparable sales up 2.3%. These increases reflected continued momentum in our Nordstrom.com channel, which increased 15%, while U.S.
full-line store net sales decreased 0.6% in 2015 compared with 2014. On a comparable basis, we experienced an increased volume of
transactions partially offset by a decrease in the average number of items sold per transaction. Category leaders included Beauty and
Women€s Apparel.
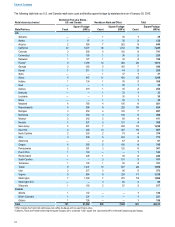
U.S. full-line store comparable sales decreased by 1.1%. The Northwest and Southwest were the top-performing full-line geographic regions.
Table of Contents
Nordstrom, Inc. and subsidiaries 19