Nordstrom 2015 Annual Report Download - page 27
Download and view the complete annual report
Please find page 27 of the 2015 Nordstrom annual report below. You can navigate through the pages in the report by either clicking on the pages listed below, or by using the keyword search tool below to find specific information within the annual report.-
 1
1 -
2
-
3
-
4
-
5
-
6
-
7
-
8
-
9
-
10
-
11
-
12
-
13
-
14
-
15
-
16
-
 17
17 -
 18
18 -
 19
19 -
 20
20 -
 21
21 -
 22
22 -
 23
23 -
 24
24 -
 25
25 -
 26
26 -
 27
27 -
 28
28 -
 29
29 -
 30
30 -
 31
31 -
 32
32 -
 33
33 -
 34
34 -
 35
35 -
 36
36 -
 37
37 -
38
-
39
-
40
-
41
-
42
-
43
-
44
-
45
-
46
-
47
-
48
-
49
-
50
-
51
-
52
-
53
-
54
-
55
-
56
-
57
-
58
-
59
-
60
-
61
-
62
-
63
-
64
-
65
-
66
-
67
-
68
-
69
-
70
-
71
-
72
-
73
-
74
-
75
-
76
-
77
 |
 |

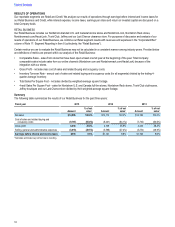
LIQUIDITY AND CAPITAL RESOURCES
We strive to maintain a level of liquidity sufficient to allow us to cover our seasonal cash needs and to maintain appropriate levels of short-
term borrowings. We believe that our operating cash flows, available credit facilities and potential future borrowings are sufficient to finance
our cash requirements for the next 12 months and beyond.
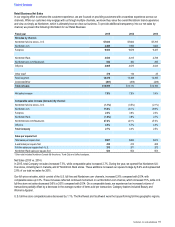
Over the long term, we manage our cash and capital structure to maximize shareholder return, maintain our financial position, manage
refinancing risk and allow flexibility for strategic initiatives. We regularly assess our debt and leverage levels, capital expenditure
requirements, debt service payments, dividend payouts, potential share repurchases and other future investments. We believe that as of
January•30, 2016, our existing cash and cash equivalents on-hand of $595, available credit facilities of $800 and potential future operating
cash flows and borrowings will be sufficient to fund these scheduled future payments and potential long-term initiatives.
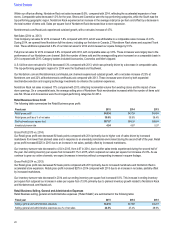
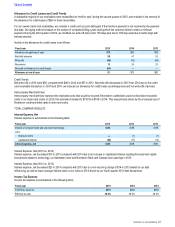
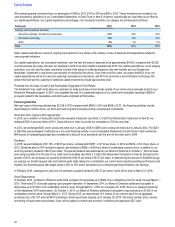
Operating Activities
Net cash provided by operating activities was $2,451 in 2015, $1,220 in 2014 and $1,320 in 2013. The majority of our operating cash inflows
are derived from sales. We also receive cash payments for property incentives from developers. Our operating cash outflows generally
consist of payments to our merchandise vendors (net of vendor allowances), payments to our employees for wages, salaries and other
employee benefits and payments to our landlords for rent. Operating cash outflows also include payments for income taxes and interest
payments on our short-term and long-term borrowings.
Cash provided by operating activities increased by $1,231 between 2015 and 2014, primarily due to $1,297 of net proceeds from the sale of
our credit card receivables (see Note 2: Credit Card Receivable Transaction in Item•8). Also within operating activities, deferred income
taxes, net and prepaid expenses and other assets were impacted by a change in an IRS rule regarding repairs of real property.
Cash•provided by•operating activities•decreased•in•2014•compared with•2013, which was primarily due to higher state tax payments made in
2014 compared with 2013, as well as changes in working capital in 2014.
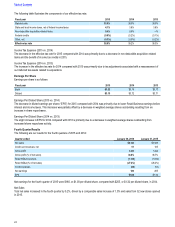
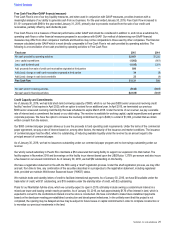
Investing Activities
Net cash used in investing activities was $144 in 2015, $889 in 2014 and $822 in 2013. The decrease in cash used in 2015 compared with
2014 is primarily due to $890 of net proceeds from the sale of our credit card receivables originated at third parties.
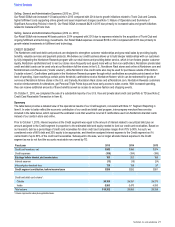
Capital Expenditures
Our capital expenditures over the last three years totaled $2,746, with $1,082 in 2015, $861 in 2014 and $803 in 2013. Capital expenditures
increased year over year primarily due to ongoing store expansion and increased technology investments.
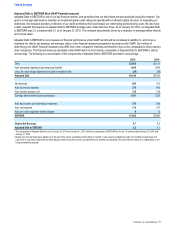
The following table summarizes our store count and square footage activity:
Store count Square footage
Fiscal year 2015 2014 2013 2015 2014 2013
Total, beginning of year 292 260 240 27.1 26.0 25.3
Store openings:
Nordstrom full-line stores - U.S. and Canada 53 … 0.8 0.4 …
Nordstrom Rack and other stores127 28 22 0.9 1.1 0.7
Stores acquired —4 … —… …
Stores closed (1)(3)(2)(0.2)(0.4)…
Total, end of year 323 292 260 28.6 27.1 26.0
1 Other includes Trunk Club clubhouses, Jeffrey boutiques and our Last Chance store.
We had one store relocation in 2015, compared with no relocations in 2014 and three relocations in 2013. Our 2015 new store openings
increased our square footage by 6.4%.
To date in 2016, we have opened three Nordstrom Rack stores and plan to open an additional 18 Nordstrom Rack stores, two full-line stores
in Canada and one full-line store in the U.S. during the remainder of 2016. Planned net store openings are expected to increase our retail
square footage by approximately 4%.
Table of Contents
Nordstrom, Inc. and subsidiaries 27