Nordstrom 2015 Annual Report Download - page 22
Download and view the complete annual report
Please find page 22 of the 2015 Nordstrom annual report below. You can navigate through the pages in the report by either clicking on the pages listed below, or by using the keyword search tool below to find specific information within the annual report.-
 1
1 -
2
-
3
-
4
-
5
-
6
-
7
-
8
-
9
-
10
-
11
-
 12
12 -
 13
13 -
 14
14 -
 15
15 -
 16
16 -
 17
17 -
 18
18 -
 19
19 -
 20
20 -
 21
21 -
 22
22 -
 23
23 -
 24
24 -
 25
25 -
 26
26 -
 27
27 -
 28
28 -
 29
29 -
 30
30 -
 31
31 -
 32
32 -
33
-
34
-
35
-
36
-
37
-
38
-
39
-
40
-
41
-
42
-
43
-
44
-
45
-
46
-
47
-
48
-
49
-
50
-
51
-
52
-
53
-
54
-
55
-
56
-
57
-
58
-
59
-
60
-
61
-
62
-
63
-
64
-
65
-
66
-
67
-
68
-
69
-
70
-
71
-
72
-
73
-
74
-
75
-
76
-
77
 |
 |

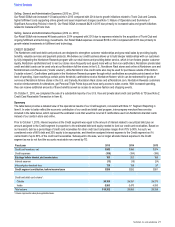
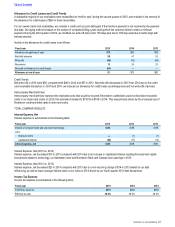
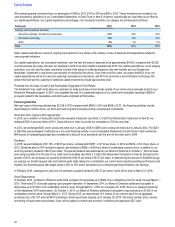
Credit Card Revenues, net
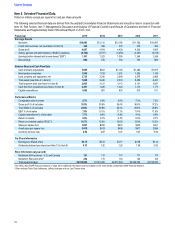
The following is a summary of our credit card revenues, net:
Fiscal year 2015 2014 2013
Finance charge revenue $173 $253 $244
Interchange 61 89 86
Late fees and other revenue 44 54 44
Credit program revenues, net 64 … …
Total credit card revenues, net $342 $396 $374
Prior to the close of the credit card receivable transaction, credit card revenues included finance charges, interchange fees, late fees and
other revenue, recorded net of estimated uncollectible finance charges and fees. Finance charges represent interest earned on unpaid
balances while interchange fees are earned from the use of Nordstrom Visa credit cards at merchants outside of Nordstrom. Late fees are
assessed when a credit card account becomes past due. We continue to recognize revenue in this manner for the credit card receivables
retained subsequent to the close of the credit card receivable transaction.
Following the close of the transaction and pursuant to the program agreement with TD, we receive our portion of the ongoing credit card
revenue, net of credit losses, from both the sold and newly generated credit card receivables, which is recorded in credit program revenues,
net. Revenue earned under the program agreement is impacted by the credit quality of receivables, both owned and serviced, and factors
such as deteriorating economic conditions, declining creditworthiness of cardholders and the success of account management and collection
activities may heighten the risk of credit losses.
Asset amortization and deferred revenue recognition associated with the assets and liabilities recorded as part of the transaction are also
recorded in credit program revenues, net.
Credit Card Revenues, net (2015 vs. 2014)
Credit card revenues, net decreased $54 in 2015 compared with 2014 due to the credit card receivable transaction.
Credit Card Revenues, net (2014 vs. 2013)
Credit card revenues, net increased $22 in 2014 compared with 2013 primarily due to an increase in the average accounts receivable
balance, slightly decreased payment rates and a 6.5% increase in total volume during 2014.
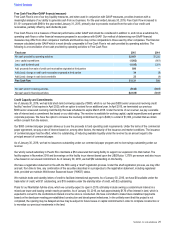
Credit Expenses
Credit expenses are summarized in the following table:
Fiscal year 2015 2014 2013
Operational expenses $155 $148 $129
Bad debt expense 26 41 52
Occupancy expenses 75 5
Credit transaction, net (29)… …
Total credit expenses $159 $194 $186
Credit Expenses (2015 vs. 2014)
Total credit expenses decreased $35 in 2015 compared with 2014, primarily due to the reversal of our allowance for credit losses, partially
offset by costs related to the credit card receivable transaction, recorded in credit transaction, net.
Credit Expenses (2014 vs. 2013)
Total credit expenses increased $8 in 2014 compared with 2013, due to higher operational expenses resulting from increased volume in 2014
and lower operational expenses in 2013 from the conversion of our Nordstrom Rewards travel benefits into Nordstrom Notes during that year.
Table of Contents
22