Nordstrom 2015 Annual Report Download - page 18
Download and view the complete annual report
Please find page 18 of the 2015 Nordstrom annual report below. You can navigate through the pages in the report by either clicking on the pages listed below, or by using the keyword search tool below to find specific information within the annual report.-
 1
1 -
2
-
3
-
4
-
5
-
6
-
7
-
 8
8 -
 9
9 -
 10
10 -
 11
11 -
 12
12 -
 13
13 -
 14
14 -
 15
15 -
 16
16 -
 17
17 -
 18
18 -
 19
19 -
 20
20 -
 21
21 -
 22
22 -
 23
23 -
 24
24 -
 25
25 -
 26
26 -
 27
27 -
 28
28 -
29
-
30
-
31
-
32
-
33
-
34
-
35
-
36
-
37
-
38
-
39
-
40
-
41
-
42
-
43
-
44
-
45
-
46
-
47
-
48
-
49
-
50
-
51
-
52
-
53
-
54
-
55
-
56
-
57
-
58
-
59
-
60
-
61
-
62
-
63
-
64
-
65
-
66
-
67
-
68
-
69
-
70
-
71
-
72
-
73
-
74
-
75
-
76
-
77
 |
 |
RESULTS OF OPERATIONS
Our reportable segments are Retail and Credit. We analyze our results of operations through earnings before interest and income taxes for
our Retail Business and Credit, while interest expense, income taxes, earnings per share and return on invested capital are discussed on a
total Company basis.
RETAIL BUSINESS
Our Retail Business includes our Nordstrom-branded U.S. and Canada full-line stores and Nordstrom.com, Nordstrom Rack stores,
Nordstromrack.com/HauteLook, Trunk Club, Jeffrey and our Last Chance clearance store. For purposes of discussion and analysis of our
results of operations of our Retail Business, we combine our Retail segment results with revenues and expenses in the ‚Corporate/Otherƒ
column of Note 17: Segment Reporting in Item•8 (collectively, the ‚Retail Businessƒ).
Certain metrics we use to evaluate the Retail Business may not be calculated in a consistent manner among industry peers. Provided below
are definitions of metrics we present within our analysis of the Retail Business:
„ Comparable Sales ‡ sales from stores that have been open at least one full year at the beginning of the year. Total Company
comparable sales include sales from our online channels (Nordstrom.com and Nordstromrack.com/HauteLook) because of the
integration with our stores.
„ Gross Profit ‡ net sales less cost of sales and related buying and occupancy costs.
„ Inventory Turnover Rate ‡ annual cost of sales and related buying and occupancy costs (for all segments) divided by the trailing 4-
quarter average inventory.
„ Total Sales Per Square Foot ‡ net sales divided by weighted-average square footage.
„ 4-wall Sales Per Square Foot ‡ sales for Nordstrom U.S. and Canada full-line stores, Nordstrom Rack stores, Trunk Club clubhouses,
Jeffrey boutiques and our Last Chance store divided by their weighted-average square footage.
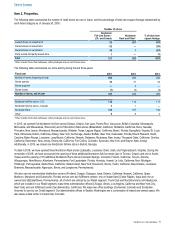
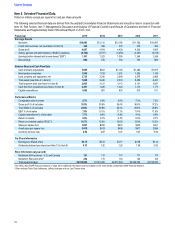
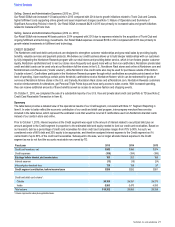
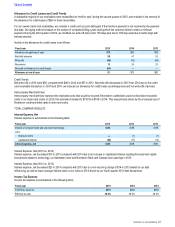
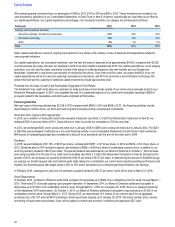
Summary
The following table summarizes the results of our Retail Business for the past three years:
Fiscal year 2015 2014 2013
Amount
%€of€net
sales1Amount
%€of€net
sales1Amount
%€of€net
sales1
Net sales $14,095 100.0%$13,110 100.0%$12,166 100.0%
Cost of sales and related buying and
occupancy costs (9,161)(65.0%) (8,401)(64.1%) (7,732)(63.6%)
Gross profit 4,934 35.0%4,709 35.9%4,434 36.4%
Selling, general and administrative expenses (4,016)(28.5%) (3,588)(27.4%) (3,272)(26.9%)
Earnings before interest and income taxes $918 6.5%$1,121 8.6%$1,162 9.6%
1 Subtotals and totals may not foot due to rounding.
Table of Contents
18