Nordstrom 2015 Annual Report Download - page 28
Download and view the complete annual report
Please find page 28 of the 2015 Nordstrom annual report below. You can navigate through the pages in the report by either clicking on the pages listed below, or by using the keyword search tool below to find specific information within the annual report.-
 1
1 -
2
-
3
-
4
-
5
-
6
-
7
-
8
-
9
-
10
-
11
-
12
-
13
-
14
-
15
-
16
-
17
-
 18
18 -
 19
19 -
 20
20 -
 21
21 -
 22
22 -
 23
23 -
 24
24 -
 25
25 -
 26
26 -
 27
27 -
 28
28 -
 29
29 -
 30
30 -
 31
31 -
 32
32 -
 33
33 -
 34
34 -
 35
35 -
 36
36 -
 37
37 -
 38
38 -
39
-
40
-
41
-
42
-
43
-
44
-
45
-
46
-
47
-
48
-
49
-
50
-
51
-
52
-
53
-
54
-
55
-
56
-
57
-
58
-
59
-
60
-
61
-
62
-
63
-
64
-
65
-
66
-
67
-
68
-
69
-
70
-
71
-
72
-
73
-
74
-
75
-
76
-
77
 |
 |

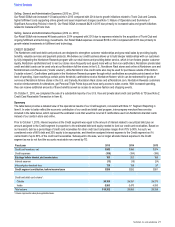
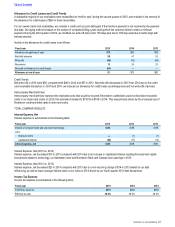
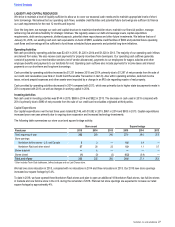
We received property incentives from our developers of $156 in 2015, $110 in 2014 and $89 in 2013. These incentives are included in our
cash provided by operations in our Consolidated Statements of Cash Flows in Item 8. However, operationally we view these as an offset to
our capital expenditures. Our capital expenditure percentages, net of property incentives, by category are summarized as follows:
Fiscal year 2015 2014 2013
Category and expenditure allocation:
New store openings, relocations and remodels 61%62%62%
Information technology 33%35%27%
Other 6%3%11%
Total 100%100%100%
Other capital expenditures consist of ongoing improvements to our stores in the ordinary course of business and expenditures related to
various growth initiatives.
Our capital expenditures, net of property incentives, over the next five years is expected to be approximately $4,000, compared with $3,300
over the previous five years. We plan our spending in 2016 to be down slightly compared with 2015. Our capital expenditures, net of property
incentives, over the next five years is primarily focused in the areas of continued expansion into new markets such as Canada and
Manhattan, investment in new stores and remodels of existing full-line stores. Over these next five years, we expect that 60% of our net
capital expenditures will be for new store openings, remodels and relocations, and 40% for ecommerce and information technology. We
believe that we have the capacity for additional capital investments should opportunities arise.
Proceeds from the Sale of Credit Card Receivables Originated at Third Parties
The Nordstrom Visa credit cards allow our customers to make purchases at merchants outside of our stores and accumulate points for our
Nordstrom Rewards program. In 2015, we completed the sale of a substantial majority of our credit card receivables resulting in $890 of
proceeds related to the receivables sold which were originated at third parties.
Financing Activities
Net cash used in financing activities was $2,539 in 2015 compared with $698 in 2014 and $589 in 2013. Our financing activities include
repurchases of common stock, our short-term and long-term borrowing activity, and payment of dividends.
Short-term and Long-term Borrowing Activity
In 2015, as a condition of closing the credit card receivable transaction (see Note 2: Credit Card Receivable Transaction in Item•8), we
defeased•$325•in secured Series 2011-1 Class A Notes in order to provide the receivables to TD free and clear.
In 2013, we exchanged $201 senior unsecured notes due in January 2038 for $265 senior unsecured notes due in January 2044. The $201
of debt that was exchanged is reflected as a non-cash financing activity in our Consolidated Statements of Cash Flows in Item 8 while the
$64 excess of outstanding principal was recorded as a discount to be amortized over the term of the notes due in 2044.
Dividends
In 2015, we paid dividends of $1,185, or $6.33 per share, compared with $251, or $1.32 per share, in 2014 and $234, or $1.20 per share, in
2013. Dividends paid in 2015 included a special cash dividend of $905, or $4.85 per share of outstanding common stock, in addition to our
recurring quarterly dividend of $0.37 per share. The special dividend was authorized by our Board of Directors on October 1, 2015 and was
paid using proceeds from the sale of our credit card receivables (see Note 2: Credit Card Receivable Transaction in Item•8). During the first
quarter of 2015, we increased our quarterly dividend from $0.33 per share to $0.37 per share. In determining the amount of dividends to pay,
we analyze our dividend payout ratio and dividend yield, while taking into consideration our current and projected operating performance and
liquidity. Our dividend payout ratio target range is 30% to 35% and is calculated as our dividend payments divided by net earnings.
In February 2016, subsequent to year end, we declared a quarterly dividend of $0.37 per share, which will be paid on March•22, 2016.
Share Repurchases
In February 2013, our Board of Directors authorized a program to repurchase up to $800 of our outstanding common stock, through March 1,
2015. There was•$73•of unused capacity upon program expiration. In September 2014, our Board of Directors authorized a program to
repurchase up to $1,000 of our outstanding common stock, through March 1, 2016. As of January•30, 2016, there is no capacity remaining
on the September 2014 authorization. On•October•1, 2015, our Board of Directors authorized a program to repurchase up to•$1,000•of our
outstanding common stock, through March 1, 2017. During 2015, we repurchased 19.1 shares of our common stock for an aggregate
purchase price of $1,191 and had $811 remaining in share repurchase capacity as of January•30, 2016. The actual number, price, manner
and timing of future share repurchases, if any, will be subject to market and economic conditions and applicable SEC rules.
Table of Contents
28