Nordstrom 2015 Annual Report Download - page 26
Download and view the complete annual report
Please find page 26 of the 2015 Nordstrom annual report below. You can navigate through the pages in the report by either clicking on the pages listed below, or by using the keyword search tool below to find specific information within the annual report.-
 1
1 -
2
-
3
-
4
-
5
-
6
-
7
-
8
-
9
-
10
-
11
-
12
-
13
-
14
-
15
-
 16
16 -
 17
17 -
 18
18 -
 19
19 -
 20
20 -
 21
21 -
 22
22 -
 23
23 -
 24
24 -
 25
25 -
 26
26 -
 27
27 -
 28
28 -
 29
29 -
 30
30 -
 31
31 -
 32
32 -
 33
33 -
 34
34 -
 35
35 -
 36
36 -
37
-
38
-
39
-
40
-
41
-
42
-
43
-
44
-
45
-
46
-
47
-
48
-
49
-
50
-
51
-
52
-
53
-
54
-
55
-
56
-
57
-
58
-
59
-
60
-
61
-
62
-
63
-
64
-
65
-
66
-
67
-
68
-
69
-
70
-
71
-
72
-
73
-
74
-
75
-
76
-
77
 |
 |

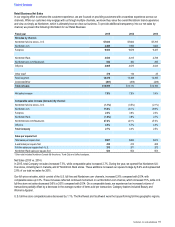
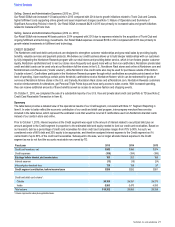
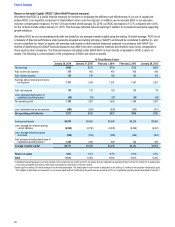
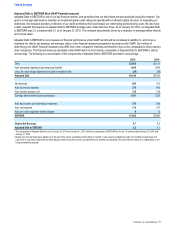
Return on Invested Capital (“ROIC”) (Non-GAAP financial measure)
We believe that ROIC is a useful financial measure for investors in evaluating the efficiency and effectiveness of our use of capital and
believe ROIC is an important component of shareholders€ return over the long term. In addition, we incorporate ROIC in our executive
incentive compensation measures. For the 12 fiscal months ended January•30, 2016, our ROIC decreased to 10.7% compared with 12.6%
for the 12 fiscal months ended January•31, 2015. This decrease reflected reduced earnings in addition to increased investments supporting
growth initiatives.
We define ROIC as our net operating profit after tax divided by our average invested capital using the trailing 12-month average. ROIC is not
a measure of financial performance under generally accepted accounting principles (‚GAAPƒ) and should be considered in addition to, and
not as a substitute for, return on assets, net earnings, total assets or other financial measures prepared in accordance with GAAP. Our
method of determining non-GAAP financial measures may differ from other companies€ methods and therefore may not be comparable to
those used by other companies. The financial measure calculated under GAAP which is most directly comparable to ROIC is return on
assets. The following is a reconciliation of the components of ROIC and return on assets:
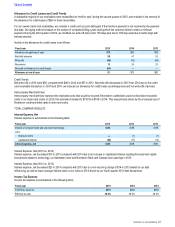
12 Fiscal Months Ended
January 30, 2016 January 31, 2015 February 1, 2014 February 2, 2013 January 28, 2012
Net earnings $600 $720 $734 $735 $683
Add: income tax expense 376 465 455 450 436
Add: interest expense 125 139 162 162 132
Earnings before interest and income
tax expense 1,101 1,324 1,351 1,347 1,251
Add: rent expense 176 137 125 105 78
Less: estimated depreciation on
capitalized operating leases1(94)(74)(67)(56)(42)
Net operating profit 1,183 1,387 1,409 1,396 1,287
Less: estimated income tax expense (456)(544)(539)(530)(501)
Net operating profit after tax $727 $843 $870 $866 $786
Average total assets $9,076 $8,860 $8,398 $8,274 $7,890
Less: average non-interest-bearing
current liabilities (2,993)(2,730)(2,430)(2,262)(2,041)
Less: average deferred property
incentives (548)(502)(489)(494)(504)
Add: average estimated asset base of
capitalized operating leases21,236 1,058 929 724 555
Average invested capital $6,771 $6,686 $6,408 $6,242 $5,900
Return on assets 6.6%8.1%8.7%8.9%8.7%
ROIC 10.7%12.6%13.6%13.9%13.3%
1 Capitalized operating leases is our best estimate of the asset base we would record for our leases that are classified as operating if they had met the criteria for a capital lease
or we had purchased the property. Asset base is calculated as described in footnote 2 below.
2 Based upon the trailing 12-month average of the monthly asset base. The asset base for each month is calculated as the trailing 12 months of rent expense multiplied by eight.
The multiple of eight times rent expense is a commonly used method of estimating the asset base we would record for our capitalized operating leases described in footnote 1.
Table of Contents
26