Nordstrom 2015 Annual Report Download - page 25
Download and view the complete annual report
Please find page 25 of the 2015 Nordstrom annual report below. You can navigate through the pages in the report by either clicking on the pages listed below, or by using the keyword search tool below to find specific information within the annual report.
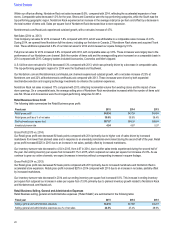
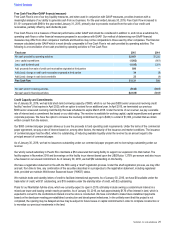
Nordstrom net sales, which consist of U.S. full-line stores and Nordstrom.com, increased $21, or 0.7%, compared with 2014, while
comparable sales increased 0.2%. These increases were primarily driven by an increase from Nordstrom.com of $77, or 11%, while U.S. full-
line net sales for the quarter decreased $56, or 2.5%. On a comparable basis, we experienced an increased volume of transactions partially
offset by a decrease in the average number of items sold per transaction. Category leaders for the quarter were Beauty and Shoes.
U.S. full-line comparable sales for the quarter decreased 3.2%. Southern California was the top-performing U.S. full-line geographic region.
Nordstrom Rack net sales increased $61, or 7%, primarily driven by 27 Nordstrom Rack new store openings since the fourth quarter of 2014,
while comparable sales decreased 3.0%. On a comparable basis, the average retail price per item sold increased, partially offset by a
decrease in the total number of items sold. Shoes and Cosmetics were the category leaders, while the South was the top-performing
geographic region.
Nordstromrack.com/HauteLook experienced outsized growth, with a net sales increase of $57, or 50%, compared with the same period in
2014.
Credit Card Revenues, net
Credit card revenues, net decreased•$54•for the quarter, compared with the same period in the prior year, primarily due to the impact of the
program agreement with TD (see Note 2: Credit Card Receivable Transaction in Item 8) and amortization of the beneficial interest asset
recorded as part of the credit card receivable transaction.
Gross Profit
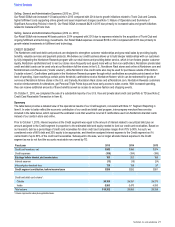
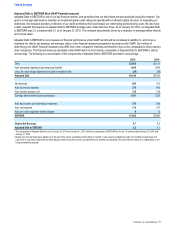
Our total Company gross profit rate decreased 184 basis points compared with the same period in the prior year, primarily due to increased
markdowns from lower than planned sales and in response to an elevated promotional environment during the holiday season.
Retail Selling, General and Administrative Expenses
Our Retail SG&A rate increased 120 basis points primarily due to asset impairment charges related to our full-line store in San Juan, Puerto
Rico, in addition to other retail and technology assets (see Note 1: Nature of Operations and Summary of Significant Accounting Policies in
Item 8), and higher fulfillment costs supporting online growth.
Credit Expenses
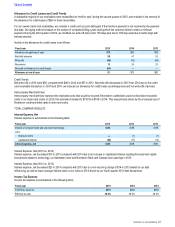
In the fourth quarter of 2015, total credit expenses decreased $18 compared with the fourth quarter of 2014, primarily driven by decreases in
bad debt expense as a result of the credit card receivable transaction (see Note 2: Credit Card Receivable Transaction in Item 8).
For further information on our quarterly results in 2015 and 2014, refer to Note 18: Selected Quarterly Data in Item•8.
2016 Outlook
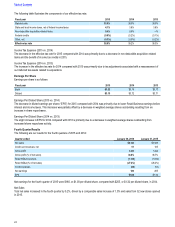
Our expectations for 2016 are as follows:
Net sales increase (percent) 3.5 to 5.5
Comparable sales increase (percent) 0 to 2
Retail EBIT increase (percent)13 to 10
Credit EBIT $70 to $80 million
Earnings per diluted share (excluding the impact of any future share
repurchases) $3.10 to $3.35
1 Excluding impairment charges of $59 million in 2015, Retail EBIT is expected to have a decrease of 3 percent to an increase of 3 percent relative to last year.
In the first half of fiscal 2016, the Company expects earnings per diluted share to decrease by approximately 30% relative to the same period
last year due to the impact of the sale of the credit card receivables, growth initiatives and the shift of the Anniversary Sale event from the
second quarter in 2015 to the second and third quarters in 2016.
Table of Contents
Nordstrom, Inc. and subsidiaries 25


