Nordstrom 2015 Annual Report Download - page 24
Download and view the complete annual report
Please find page 24 of the 2015 Nordstrom annual report below. You can navigate through the pages in the report by either clicking on the pages listed below, or by using the keyword search tool below to find specific information within the annual report.-
 1
1 -
2
-
3
-
4
-
5
-
6
-
7
-
8
-
9
-
10
-
11
-
12
-
13
-
 14
14 -
 15
15 -
 16
16 -
 17
17 -
 18
18 -
 19
19 -
 20
20 -
 21
21 -
 22
22 -
 23
23 -
 24
24 -
 25
25 -
 26
26 -
 27
27 -
 28
28 -
 29
29 -
 30
30 -
 31
31 -
 32
32 -
 33
33 -
 34
34 -
35
-
36
-
37
-
38
-
39
-
40
-
41
-
42
-
43
-
44
-
45
-
46
-
47
-
48
-
49
-
50
-
51
-
52
-
53
-
54
-
55
-
56
-
57
-
58
-
59
-
60
-
61
-
62
-
63
-
64
-
65
-
66
-
67
-
68
-
69
-
70
-
71
-
72
-
73
-
74
-
75
-
76
-
77
 |
 |

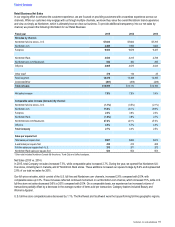
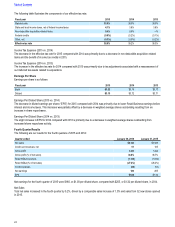
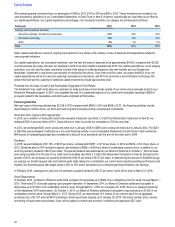
The following table illustrates the components of our effective tax rate:
Fiscal year 2015 2014 2013
Statutory rate 35.0%35.0%35.0%
State and local income taxes, net of federal income taxes 4.1%3.8%3.6%
Non-deductible acquisition-related items 0.4%0.9%…%
Federal credits (0.6%) (0.2%) (0.1%)
Other, net (0.3%) (0.3%) (0.2%)
Effective tax rate 38.6%39.2%38.3%
Income Tax Expense (2015 vs. 2014)
The decrease in the effective tax rate for 2015 compared with 2014 was primarily due to a decrease in non-deductible acquisition-related
items and the benefit of income tax credits in 2015.
Income Tax Expense (2014 vs. 2013)
The increase in the effective tax rate for 2014 compared with 2013 was primarily due to tax adjustments associated with a reassessment of
our deferred tax assets related to acquisitions.
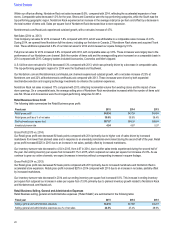
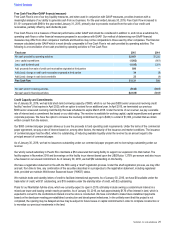
Earnings Per Share
Earnings per share is as follows:
Fiscal year 2015 2014 2013
Basic $3.22 $3.79 $3.77
Diluted $3.15 $3.72 $3.71
Earnings Per Diluted Share (2015 vs. 2014)
The decrease in diluted earnings per share (‚EPSƒ) for 2015 compared with 2014 was primarily due to lower Retail Business earnings before
interest and income taxes. This decrease was partially offset by a decrease in weighted average shares outstanding resulting from an
increase in share repurchases.
Earnings Per Diluted Share (2014 vs. 2013)
The slight increase in EPS for 2014 compared with 2013 is primarily due to a decrease in weighted average shares outstanding from
increased share repurchase activity.
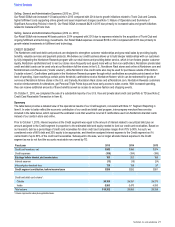
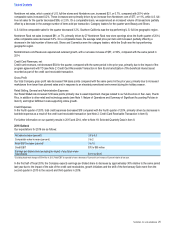
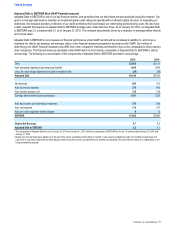
Fourth Quarter Results
The following are our results for the fourth quarters of 2015 and 2014:
Quarter ended January 30, 2016 January 31, 2015
Net sales $4,143 $3,938
Credit card revenues, net 51 105
Gross profit 1,443 1,444
Gross profit (% of net sales) 34.8%36.7%
Retail SG&A expenses (1,136)(1,032)
Retail SG&A (% of net sales) (27.4%) (26.2%)
Credit expenses (36)(54)
Net earnings 180 255
EPS $1.00 $1.32
Net earnings for the fourth quarter of 2015 were $180, or $1.00 per diluted share, compared with $255, or $1.32 per diluted share, in 2014.
Net Sales
Total net sales increased in the fourth quarter by 5.2%, driven by a comparable sales increase of 1.0% and sales from 32 new stores opened
in 2015.
Table of Contents
24