Nordstrom 2014 Annual Report Download - page 65
Download and view the complete annual report
Please find page 65 of the 2014 Nordstrom annual report below. You can navigate through the pages in the report by either clicking on the pages listed below, or by using the keyword search tool below to find specific information within the annual report.-
 1
1 -
2
-
3
-
4
-
5
-
6
-
7
-
8
-
9
-
10
-
11
-
12
-
13
-
14
-
15
-
16
-
17
-
18
-
19
-
20
-
21
-
22
-
23
-
24
-
25
-
26
-
27
-
28
-
29
-
30
-
31
-
32
-
33
-
34
-
35
-
36
-
37
-
38
-
39
-
40
-
41
-
42
-
43
-
44
-
45
-
46
-
47
-
48
-
49
-
50
-
51
-
52
-
53
-
54
-
 55
55 -
 56
56 -
 57
57 -
 58
58 -
 59
59 -
 60
60 -
 61
61 -
 62
62 -
 63
63 -
 64
64 -
 65
65 -
 66
66 -
 67
67 -
 68
68 -
 69
69 -
 70
70 -
 71
71 -
 72
72 -
 73
73 -
 74
74 -
 75
75 -
76
-
77
-
78
 |
 |

Table of Contents
Nordstrom, Inc.
Notes to Consolidated Financial Statements
Dollar and share amounts in millions except per share, per option and per unit amounts
Nordstrom, Inc. and subsidiaries 65
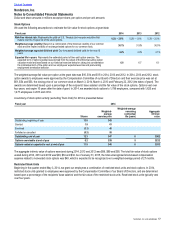
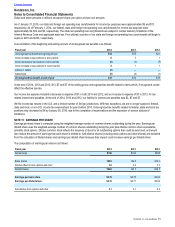
NOTE 17: SELECTED QUARTERLY DATA1 (UNAUDITED)
1st Quarter 2nd Quarter 3rd Quarter 4th Quarter Total
Fiscal year 2014
Net sales $2,837 $3,296 $3,040 $3,938 $13,110
Comparable sales increase23.9% 3.3% 3.9% 4.7% 4.0%
Credit card revenues 94 96 100 105 396
Gross profit31,015 1,166 1,079 1,444 4,704
Selling, general and administrative expenses (844) (931) (917) (1,084) (3,777)
Earnings before income taxes 230 296 228 431 1,185
Net earnings 140 183 142 255 720
Earnings per basic share $0.74 $0.97 $0.74 $1.35 $3.79
Earnings per diluted share $0.72 $0.95 $0.73 $1.32 $3.72
Fiscal year 2013
Net sales $2,657 $3,104 $2,791 $3,614 $12,166
Comparable sales increase22.7% 4.4% 0.1% 2.6% 2.5%
Credit card revenues 92 92 93 97 374
Gross profit3984 1,100 1,000 1,345 4,429
Selling, general and administrative expenses (801) (857) (840) (955) (3,453)
Earnings before income taxes 236 298 218 437 1,189
Net earnings 145 184 137 268 734
Earnings per basic share $0.74 $0.94 $0.70 $1.39 $3.77
Earnings per diluted share $0.73 $0.93 $0.69 $1.37 $3.71
1 Quarterly totals may not foot across due to rounding.
2 Comparable sales include sales from stores that have been open at least one full year at the beginning of the year. We also include sales from our online channels
(Nordstrom.com, Nordstromrack.com and HauteLook) in comparable sales because of the integration with our stores.
3 Gross profit is calculated as net sales less cost of sales and related buying and occupancy costs (for all segments).