Nordstrom 2014 Annual Report Download - page 49
Download and view the complete annual report
Please find page 49 of the 2014 Nordstrom annual report below. You can navigate through the pages in the report by either clicking on the pages listed below, or by using the keyword search tool below to find specific information within the annual report.-
 1
1 -
2
-
3
-
4
-
5
-
6
-
7
-
8
-
9
-
10
-
11
-
12
-
13
-
14
-
15
-
16
-
17
-
18
-
19
-
20
-
21
-
22
-
23
-
24
-
25
-
26
-
27
-
28
-
29
-
30
-
31
-
32
-
33
-
34
-
35
-
36
-
37
-
38
-
 39
39 -
 40
40 -
 41
41 -
 42
42 -
 43
43 -
 44
44 -
 45
45 -
 46
46 -
 47
47 -
 48
48 -
 49
49 -
 50
50 -
 51
51 -
 52
52 -
 53
53 -
 54
54 -
 55
55 -
 56
56 -
 57
57 -
 58
58 -
 59
59 -
60
-
61
-
62
-
63
-
64
-
65
-
66
-
67
-
68
-
69
-
70
-
71
-
72
-
73
-
74
-
75
-
76
-
77
-
78
 |
 |
Table of Contents
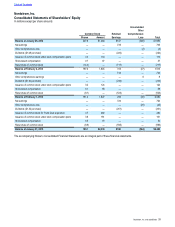
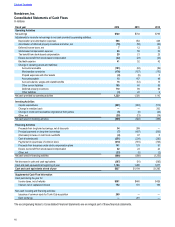
Nordstrom, Inc.
Notes to Consolidated Financial Statements
Dollar and share amounts in millions except per share, per option and per unit amounts
Nordstrom, Inc. and subsidiaries 49
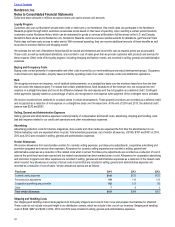
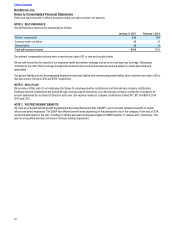
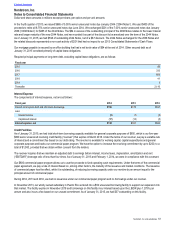
Credit Quality
The primary indicators of the credit quality of our credit card receivables are aging and delinquency, particularly the levels of account
balances delinquent 30 days or more, as these are the accounts most likely to be written off. The following table illustrates the aging and
delinquency status of our credit card receivables:
January 31, 2015 February 1, 2014
Balance % of total Balance % of total
Current $2,134 93.4% $2,046 93.7%
1 – 29 days delinquent 103 4.5% 99 4.5%
30 days or more delinquent:
30 – 59 days delinquent 16 0.7% 16 0.7%
60 – 89 days delinquent 10 0.5% 9 0.4%
90 days or more delinquent 21 0.9% 14 0.7%
Total 30 days or more delinquent 47 2.1% 39 1.8%
Total credit card receivables $2,284 100.0% $2,184 100.0%
Receivables not accruing finance charges $13 $13
Receivables 90 days or more delinquent and still
accruing finance charges $13 $8
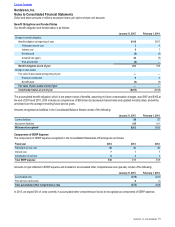
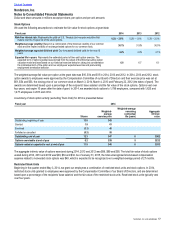
We also evaluate credit quality using FICO credit scores. The following table illustrates the distribution of our credit card receivables across
FICO score ranges:
January 31, 2015 February 1, 2014
FICO Score Range1Balance % of total Balance % of total
801+ $369 16.2% $313 14.3%
660 – 800 1,435 62.8% 1,393 63.8%
001 – 659 392 17.1% 379 17.4%
Other288 3.9% 99 4.5%
Total credit card receivables $2,284 100.0% $2,184 100.0%
1 Credit scores for our credit cardholders are updated at least every 60 days for active accounts and every 90 days for inactive accounts. Amounts listed in the table reflect the
most recently obtained credit scores as of the dates indicated.
2 Other consists of amounts not yet posted to customers’ accounts and receivables from customers for whom FICO scores are temporarily unavailable.
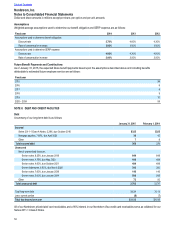
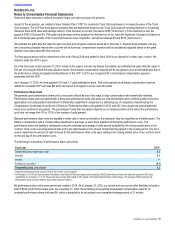
NOTE 4: LAND, PROPERTY AND EQUIPMENT
Land, property and equipment consist of the following:
January 31, 2015 February 1, 2014
Land and land improvements $99 $80
Buildings and building improvements 1,040 991
Leasehold improvements 2,510 2,330
Store fixtures and equipment 3,055 2,894
Capitalized software 739 628
Construction in progress 595 421
Land, property and equipment 8,038 7,344
Less: accumulated depreciation and amortization (4,698) (4,395)
Land, property and equipment, net $3,340 $2,949
The total cost of property and equipment held under capital lease obligations was $28 at the end of both 2014 and 2013, with related
accumulated amortization of $26 in 2014 and $25 in 2013. Depreciation expense was $498 in 2014, $444 in 2013 and $410 in 2012.