Nordstrom 2014 Annual Report Download - page 17
Download and view the complete annual report
Please find page 17 of the 2014 Nordstrom annual report below. You can navigate through the pages in the report by either clicking on the pages listed below, or by using the keyword search tool below to find specific information within the annual report.-
 1
1 -
2
-
3
-
4
-
5
-
6
-
 7
7 -
 8
8 -
 9
9 -
 10
10 -
 11
11 -
 12
12 -
 13
13 -
 14
14 -
 15
15 -
 16
16 -
 17
17 -
 18
18 -
 19
19 -
 20
20 -
 21
21 -
 22
22 -
 23
23 -
 24
24 -
 25
25 -
 26
26 -
 27
27 -
28
-
29
-
30
-
31
-
32
-
33
-
34
-
35
-
36
-
37
-
38
-
39
-
40
-
41
-
42
-
43
-
44
-
45
-
46
-
47
-
48
-
49
-
50
-
51
-
52
-
53
-
54
-
55
-
56
-
57
-
58
-
59
-
60
-
61
-
62
-
63
-
64
-
65
-
66
-
67
-
68
-
69
-
70
-
71
-
72
-
73
-
74
-
75
-
76
-
77
-
78
 |
 |

Table of Contents
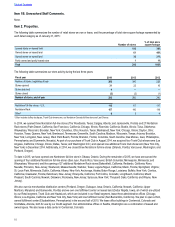
Nordstrom, Inc. and subsidiaries 17
RESULTS OF OPERATIONS
Our reportable segments are Retail and Credit. Our Retail segment includes our U.S. Nordstrom branded full-line stores and online store,
Nordstrom Rack stores, Nordstromrack.com and HauteLook and other retail channels, including Trunk Club, Jeffrey, our Canada store and
our Last Chance clearance store. For purposes of discussion and analysis of our results of operations of our Retail Business, we combine
our Retail segment results with revenues and expenses in the “Corporate/Other” column of Note 16: Segment Reporting in the Notes to
Consolidated Financial Statements of Item 8: Financial Statements and Supplementary Data. We analyze our results of operations through
earnings before interest and income taxes for our Retail Business and Credit, while interest expense and income taxes are discussed on a
total company basis.
Similar to many other retailers, Nordstrom follows the retail 4-5-4 reporting calendar, which included an extra week in the fourth quarter of
2012 (the “53rd week”). The analysis of our results of operations, liquidity and capital resources compares the 52 weeks in 2013 to the 53
weeks in 2012. However, the 53rd week is not included in comparable sales calculations. In 2012, the 53rd week contributed approximately
$0.04 to earnings per diluted share.
RETAIL BUSINESS
Summary
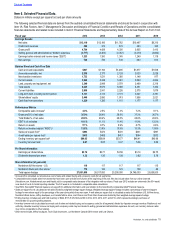
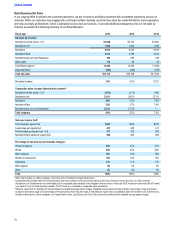
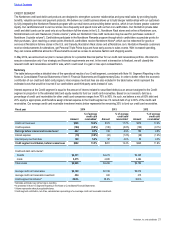
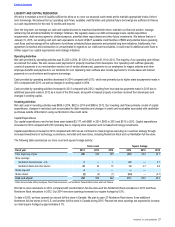
The following table summarizes the results of our Retail Business for the past three years:
Fiscal year 2014 2013 2012
Amount % of net
sales1Amount % of net
sales1Amount % of net
sales1
Net sales $13,110 100.0% $12,166 100.0% $11,762 100.0%
Cost of sales and related buying and
occupancy costs (8,401) (64.1%) (7,732) (63.6%) (7,427) (63.1%)
Gross profit 4,709 35.9% 4,434 36.4% 4,335 36.9%
Selling, general and administrative expenses (3,588) (27.4%) (3,272) (26.9%) (3,172) (27.0%)
Earnings before interest and income taxes $1,121 8.6% $1,162 9.6% $1,163 9.9%
1 Subtotals and totals may not foot due to rounding.