Nordstrom 2014 Annual Report Download - page 63
Download and view the complete annual report
Please find page 63 of the 2014 Nordstrom annual report below. You can navigate through the pages in the report by either clicking on the pages listed below, or by using the keyword search tool below to find specific information within the annual report.-
 1
1 -
2
-
3
-
4
-
5
-
6
-
7
-
8
-
9
-
10
-
11
-
12
-
13
-
14
-
15
-
16
-
17
-
18
-
19
-
20
-
21
-
22
-
23
-
24
-
25
-
26
-
27
-
28
-
29
-
30
-
31
-
32
-
33
-
34
-
35
-
36
-
37
-
38
-
39
-
40
-
41
-
42
-
43
-
44
-
45
-
46
-
47
-
48
-
49
-
50
-
51
-
52
-
 53
53 -
 54
54 -
 55
55 -
 56
56 -
 57
57 -
 58
58 -
 59
59 -
 60
60 -
 61
61 -
 62
62 -
 63
63 -
 64
64 -
 65
65 -
 66
66 -
 67
67 -
 68
68 -
 69
69 -
 70
70 -
 71
71 -
 72
72 -
 73
73 -
74
-
75
-
76
-
77
-
78
 |
 |

Table of Contents
Nordstrom, Inc.
Notes to Consolidated Financial Statements
Dollar and share amounts in millions except per share, per option and per unit amounts
Nordstrom, Inc. and subsidiaries 63
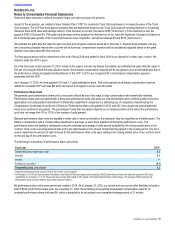
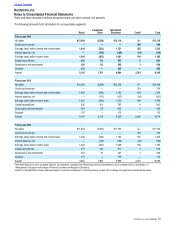
The following table sets forth information for our reportable segments:
Retail Corporate/
Other Total Retail
Business1Credit Total
Fiscal year 2014
Net sales $13,369 ($259) $13,110 $— $13,110
Credit card revenues — — — 396 396
Earnings (loss) before interest and income taxes 1,404 (283) 1,121 202 1,323
Interest expense, net — (120) (120) (18) (138)
Earnings (loss) before income taxes 1,404 (403) 1,001 184 1,185
Capital expenditures 683 172 855 6 861
Depreciation and amortization 393 112 505 3 508
Goodwill 435 — 435 — 435
Assets25,103 1,781 6,884 2,361 9,245
Fiscal year 2013
Net sales $12,395 ($229) $12,166 $— $12,166
Credit card revenues — — — 374 374
Earnings (loss) before interest and income taxes 1,420 (258) 1,162 188 1,350
Interest expense, net — (137) (137) (24) (161)
Earnings (loss) before income taxes 1,420 (395) 1,025 164 1,189
Capital expenditures 636 161 797 6 803
Depreciation and amortization 364 88 452 2 454
Goodwill 175 — 175 — 175
Assets24,191 2,118 6,309 2,265 8,574
Fiscal year 2012
Net sales $11,949 ($187) $11,762 $— $11,762
Credit card revenues — — — 372 372
Earnings (loss) before interest and income taxes 1,409 (246) 1,163 182 1,345
Interest expense, net — (134) (134) (26) (160)
Earnings (loss) before income taxes 1,409 (380) 1,029 156 1,185
Capital expenditures 371 140 511 2 513
Depreciation and amortization 357 70 427 2 429
Goodwill 175 — 175 — 175
Assets23,922 1,966 5,888 2,201 8,089
1 Total Retail Business is not a reportable segment, but represents a subtotal of the Retail segment and Corporate/Other, and is consistent with our presentation in
Management’s Discussion and Analysis of Financial Condition and Results of Operations.
2 Assets in Corporate/Other include unallocated assets in corporate headquarters, consisting primarily of cash, land, buildings and equipment and deferred tax assets.