Nordstrom 2014 Annual Report Download - page 40
Download and view the complete annual report
Please find page 40 of the 2014 Nordstrom annual report below. You can navigate through the pages in the report by either clicking on the pages listed below, or by using the keyword search tool below to find specific information within the annual report.-
 1
1 -
2
-
3
-
4
-
5
-
6
-
7
-
8
-
9
-
10
-
11
-
12
-
13
-
14
-
15
-
16
-
17
-
18
-
19
-
20
-
21
-
22
-
23
-
24
-
25
-
26
-
27
-
28
-
29
-
 30
30 -
 31
31 -
 32
32 -
 33
33 -
 34
34 -
 35
35 -
 36
36 -
 37
37 -
 38
38 -
 39
39 -
 40
40 -
 41
41 -
 42
42 -
 43
43 -
 44
44 -
 45
45 -
 46
46 -
 47
47 -
 48
48 -
 49
49 -
 50
50 -
51
-
52
-
53
-
54
-
55
-
56
-
57
-
58
-
59
-
60
-
61
-
62
-
63
-
64
-
65
-
66
-
67
-
68
-
69
-
70
-
71
-
72
-
73
-
74
-
75
-
76
-
77
-
78
 |
 |

Table of Contents
40
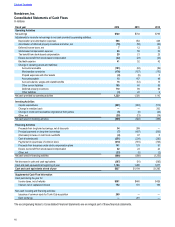
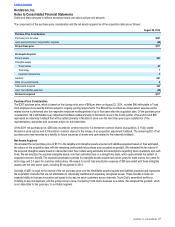
Nordstrom, Inc.
Consolidated Statements of Cash Flows
In millions
Fiscal year 2014 2013 2012
Operating Activities
Net earnings $720 $734 $735
Adjustments to reconcile net earnings to net cash provided by operating activities:
Depreciation and amortization expenses 508 454 429
Amortization of deferred property incentives and other, net (76) (58) (63)
Deferred income taxes, net 712 22
Stock-based compensation expense 68 58 53
Tax benefit from stock-based compensation 20 21 23
Excess tax benefit from stock-based compensation (22) (23) (24)
Bad debt expense 41 52 42
Change in operating assets and liabilities:
Accounts receivable (161) (93) (99)
Merchandise inventories (176) (157) (170)
Prepaid expenses and other assets (4) (6) 5
Accounts payable 15 167 48
Accrued salaries, wages and related benefits 18 (12) 13
Other current liabilities 155 60 36
Deferred property incentives 110 89 58
Other liabilities (3) 22 2
Net cash provided by operating activities 1,220 1,320 1,110
Investing Activities
Capital expenditures (861) (803) (513)
Change in restricted cash —— 200
Change in credit card receivables originated at third parties (8) (6) (42)
Other, net (20) (13) (14)
Net cash used in investing activities (889) (822) (369)
Financing Activities
Proceeds from long-term borrowings, net of discounts 34 399 —
Principal payments on long-term borrowings (7) (407) (506)
(Decrease) increase in cash book overdrafts (4) 47 5
Cash dividends paid (251) (234) (220)
Payments for repurchase of common stock (610) (515) (725)
Proceeds from issuances under stock compensation plans 141 103 91
Excess tax benefit from stock-based compensation 22 23 24
Other, net (23) (5) (2)
Net cash used in financing activities (698) (589) (1,333)
Net decrease in cash and cash equivalents (367) (91) (592)
Cash and cash equivalents at beginning of year 1,194 1,285 1,877
Cash and cash equivalents at end of year $827 $1,194 $1,285
Supplemental Cash Flow Information
Cash paid during the year for:
Income taxes, net of refunds $391 $445 $429
Interest, net of capitalized interest 152 170 169
Non-cash investing and financing activities:
Issuance of common stock for Trunk Club acquisition 280 — —
Debt exchange —201 —
The accompanying Notes to Consolidated Financial Statements are an integral part of these financial statements.