Nordstrom 2014 Annual Report Download - page 22
Download and view the complete annual report
Please find page 22 of the 2014 Nordstrom annual report below. You can navigate through the pages in the report by either clicking on the pages listed below, or by using the keyword search tool below to find specific information within the annual report.-
 1
1 -
2
-
3
-
4
-
5
-
6
-
7
-
8
-
9
-
10
-
11
-
 12
12 -
 13
13 -
 14
14 -
 15
15 -
 16
16 -
 17
17 -
 18
18 -
 19
19 -
 20
20 -
 21
21 -
 22
22 -
 23
23 -
 24
24 -
 25
25 -
 26
26 -
 27
27 -
 28
28 -
 29
29 -
 30
30 -
 31
31 -
 32
32 -
33
-
34
-
35
-
36
-
37
-
38
-
39
-
40
-
41
-
42
-
43
-
44
-
45
-
46
-
47
-
48
-
49
-
50
-
51
-
52
-
53
-
54
-
55
-
56
-
57
-
58
-
59
-
60
-
61
-
62
-
63
-
64
-
65
-
66
-
67
-
68
-
69
-
70
-
71
-
72
-
73
-
74
-
75
-
76
-
77
-
78
 |
 |

Table of Contents
22
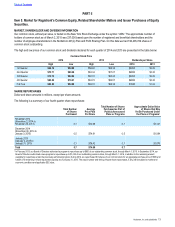
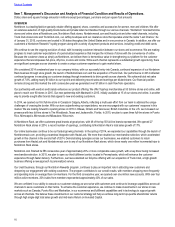
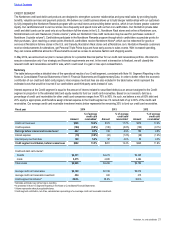
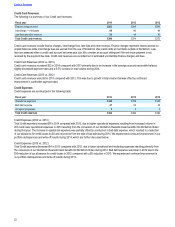
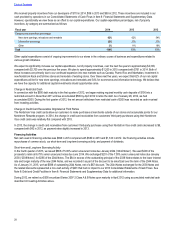
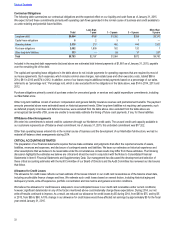
Credit Card Revenues
The following is a summary of our Credit card revenues:
Fiscal year 2014 2013 2012
Finance charge revenue $253 $244 $246
Interchange — third-party 89 86 84
Late fees and other revenue 54 44 42
Total Credit card revenues $396 $374 $372
Credit card revenues include finance charges, interchange fees, late fees and other revenue. Finance charges represent interest earned on
unpaid balances while interchange fees are earned from the use of Nordstrom Visa credit cards at merchants outside of Nordstrom. Late
fees are assessed when a credit card account becomes past due. We consider an account delinquent if the minimum payment is not
received by the payment due date. Credit card revenues are recorded net of estimated uncollectible finance charges and fees.
Credit Card Revenues (2014 vs. 2013)
Credit card revenues increased $22 in 2014 compared with 2013 primarily due to an increase in the average accounts receivable balance,
slightly decreased payment rates and a 6.5% increase in total volume during 2014.
Credit Card Revenues (2013 vs. 2012)
Credit card revenues were flat in 2013 compared with 2012. This was due to growth in total volume that was offset by continued
improvement in cardholder payment rates.
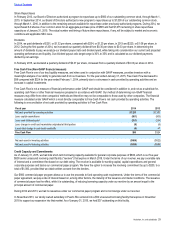
Credit Expenses
Credit expenses are summarized in the following table:
Fiscal year 2014 2013 2012
Operational expenses $148 $129 $143
Bad debt expense 41 52 42
Occupancy expenses 55 5
Total Credit expenses $194 $186 $190
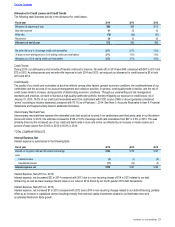
Credit Expenses (2014 vs. 2013)
Total Credit expenses increased $8 in 2014 compared with 2013, due to higher operational expenses resulting from increased volume in
2014 and lower operational expenses in 2013 resulting from the conversion of our Nordstrom Rewards travel benefits into Nordstrom Notes
during that year. The increase in operational expenses was partially offset by a reduction in bad debt expense, which resulted in a reduction
of our allowance for credit losses by $5 and recoveries from the sale of bad debt during 2014. We experienced continued improvement in our
portfolio delinquencies and write-off results during 2014, which are further discussed below.
Credit Expenses (2013 vs. 2012)
Total Credit expenses decreased $4 in 2013 compared with 2012, due to lower operational and marketing expenses resulting primarily from
the conversion of our Nordstrom Rewards travel benefit into Nordstrom Notes during 2013. Bad debt expense was lower in 2012 due to the
$30 reduction of our allowance for credit losses in 2012 compared with a $5 reduction in 2013. We experienced continued improvement in
our portfolio delinquencies and write-off results during 2013.