Nordstrom 2014 Annual Report Download - page 59
Download and view the complete annual report
Please find page 59 of the 2014 Nordstrom annual report below. You can navigate through the pages in the report by either clicking on the pages listed below, or by using the keyword search tool below to find specific information within the annual report.-
 1
1 -
2
-
3
-
4
-
5
-
6
-
7
-
8
-
9
-
10
-
11
-
12
-
13
-
14
-
15
-
16
-
17
-
18
-
19
-
20
-
21
-
22
-
23
-
24
-
25
-
26
-
27
-
28
-
29
-
30
-
31
-
32
-
33
-
34
-
35
-
36
-
37
-
38
-
39
-
40
-
41
-
42
-
43
-
44
-
45
-
46
-
47
-
48
-
 49
49 -
 50
50 -
 51
51 -
 52
52 -
 53
53 -
 54
54 -
 55
55 -
 56
56 -
 57
57 -
 58
58 -
 59
59 -
 60
60 -
 61
61 -
 62
62 -
 63
63 -
 64
64 -
 65
65 -
 66
66 -
 67
67 -
 68
68 -
 69
69 -
70
-
71
-
72
-
73
-
74
-
75
-
76
-
77
-
78
 |
 |

Table of Contents
Nordstrom, Inc.
Notes to Consolidated Financial Statements
Dollar and share amounts in millions except per share, per option and per unit amounts
Nordstrom, Inc. and subsidiaries 59
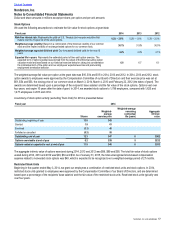
As part of the acquisition, we created a Value Creation Plan (“VCP”) to incentivize Trunk Club employees to increase the value of the Trunk
Club business. The VCP has three payout scenarios that are determined based on the Trunk Club business meeting minimum or exceeding
maximum fiscal 2018 sales and earnings metrics. If the minimum is not met, the payout is $0 (“Outcome A”); if the maximum is met, the
payout is $100 (“Outcome B”). If the sales and earnings metrics surpass the minimum but do not reach the maximum, the payout is based on
the incremental value growth of the Trunk Club business since acquisition, and will be between $0 and $100 (“Outcome C”).
We estimate the grant date fair value for each outcome and recognize expense based upon Outcome C, deemed most probable. If at any
time it becomes probable that another outcome will be achieved, compensation expense will be cumulatively adjusted based on the grant
date fair value associated with that outcome.
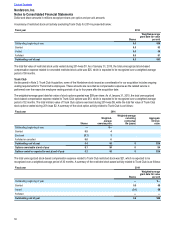
The final payout amount will be determined at the end of fiscal 2018 and settled in fiscal 2019 at our discretion in either cash or stock. We
intend to settle the VCP in stock.
As of the fiscal year ended January 31, 2015, based on the payout scenario we believe is probable, we estimated the grant date fair value of
$10 per unit using the Black-Scholes valuation model. Stock-based compensation expense will be recognized on an accelerated basis due to
the performance criteria and graded vesting features of the VCP. In 2014, we recognized $3 in stock-based compensation expense
associated with the VCP.
As of January 31, 2015, we have granted 0.8 of the 1.0 units available for grant. Total unrecognized stock-based compensation expense
related to nonvested VCP units was $6, which we expect to recognize over the next 43 months.
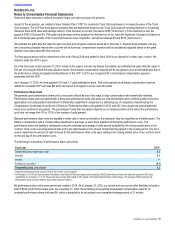
Performance Share Units
We generally grant performance share units to executive officers as one of the ways to align compensation with shareholder interests.
Performance share units are earned after a three-year performance cycle only when our total shareholder return (reflecting daily stock price
appreciation and compounded reinvestment of dividends) outperforms companies in a defined group of competitors determined by the
Compensation Committee of our Board of Directors. Performance share units granted in 2012 and 2013 also require the total shareholder
return to be positive for any payout. The percentage of units that are earned depends on our relative position at the end of the performance
cycle and can range from 0% to 175% of the number of units granted.
Because performance share units are payable in either cash or stock as elected by the employee, they are classified as a liability award. The
liability is remeasured, with a corresponding adjustment to earnings, at each fiscal quarter-end during the performance cycle. The
performance share unit liability is remeasured using the estimated percentage of units earned multiplied by the closing market price of our
common stock on the current period-end date and is pro-rated based on the amount of time that has passed in the vesting period. The price
used to determine the amount of cash received for the performance share units upon vesting is the closing market price of our common stock
on the last day of the performance cycle.
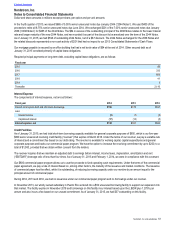
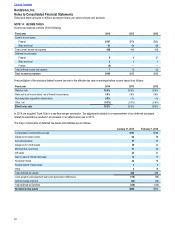
The following is a summary of performance share unit activity:
Fiscal year 20141
Outstanding units, beginning of year 0.2
Granted 0.1
Vested —
Forfeited or cancelled (0.1)
Outstanding units, end of year20.2
1 Assumes performance share units at 100% of the number of units granted.
2 On February 13, 2015, the Compensation Committee of our Board of Directors approved the vesting of 48,229 performance share units that were granted in 2012 and
outstanding as of January 31, 2015. Those units were earned and vested at 75% based on the defined performance criteria above. For purposes of this footnote only,
performance share units are stated in exact units instead of millions.
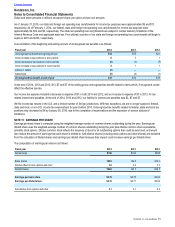
No performance share units were earned and vested in 2014. As of January 31, 2015, our current and non-current other liabilities included a
total of $8 for performance share units. As of January 31, 2015, the remaining unrecognized stock-based compensation expense for
unvested performance share units was $6, which is expected to be recognized over a weighted-average period of 21 months.