Nordstrom 2014 Annual Report Download - page 14
Download and view the complete annual report
Please find page 14 of the 2014 Nordstrom annual report below. You can navigate through the pages in the report by either clicking on the pages listed below, or by using the keyword search tool below to find specific information within the annual report.-
 1
1 -
2
-
3
-
 4
4 -
 5
5 -
 6
6 -
 7
7 -
 8
8 -
 9
9 -
 10
10 -
 11
11 -
 12
12 -
 13
13 -
 14
14 -
 15
15 -
 16
16 -
 17
17 -
 18
18 -
 19
19 -
 20
20 -
 21
21 -
 22
22 -
 23
23 -
 24
24 -
25
-
26
-
27
-
28
-
29
-
30
-
31
-
32
-
33
-
34
-
35
-
36
-
37
-
38
-
39
-
40
-
41
-
42
-
43
-
44
-
45
-
46
-
47
-
48
-
49
-
50
-
51
-
52
-
53
-
54
-
55
-
56
-
57
-
58
-
59
-
60
-
61
-
62
-
63
-
64
-
65
-
66
-
67
-
68
-
69
-
70
-
71
-
72
-
73
-
74
-
75
-
76
-
77
-
78
 |
 |

Table of Contents
14
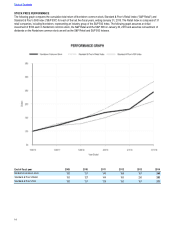
STOCK PRICE PERFORMANCE
The following graph compares the cumulative total return of Nordstrom common stock, Standard & Poor’s Retail Index (“S&P Retail”) and
Standard & Poor’s 500 Index (“S&P 500”) for each of the last five fiscal years, ending January 31, 2015. The Retail Index is composed of 31
retail companies, including Nordstrom, representing an industry group of the S&P 500 Index. The following graph assumes an initial
investment of $100 each in Nordstrom common stock, the S&P Retail and the S&P 500 on January 30, 2010 and assumes reinvestment of
dividends on the Nordstrom common stock as well as the S&P Retail and S&P 500 Indexes.
End of fiscal year 2009 2010 2011 2012 2013 2014
Nordstrom common stock 100 121 146 169 181 245
Standard & Poor’s Retail 100 127 144 183 230 283
Standard & Poor’s 500 100 121 128 150 181 211