Nordstrom 2014 Annual Report Download - page 29
Download and view the complete annual report
Please find page 29 of the 2014 Nordstrom annual report below. You can navigate through the pages in the report by either clicking on the pages listed below, or by using the keyword search tool below to find specific information within the annual report.-
 1
1 -
2
-
3
-
4
-
5
-
6
-
7
-
8
-
9
-
10
-
11
-
12
-
13
-
14
-
15
-
16
-
17
-
18
-
 19
19 -
 20
20 -
 21
21 -
 22
22 -
 23
23 -
 24
24 -
 25
25 -
 26
26 -
 27
27 -
 28
28 -
 29
29 -
 30
30 -
 31
31 -
 32
32 -
 33
33 -
 34
34 -
 35
35 -
 36
36 -
 37
37 -
 38
38 -
 39
39 -
40
-
41
-
42
-
43
-
44
-
45
-
46
-
47
-
48
-
49
-
50
-
51
-
52
-
53
-
54
-
55
-
56
-
57
-
58
-
59
-
60
-
61
-
62
-
63
-
64
-
65
-
66
-
67
-
68
-
69
-
70
-
71
-
72
-
73
-
74
-
75
-
76
-
77
-
78
 |
 |

Table of Contents
Nordstrom, Inc. and subsidiaries 29
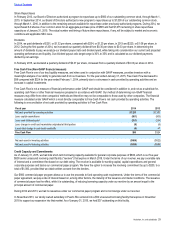
Share Repurchases
In February 2013, our Board of Directors authorized a program to repurchase up to $800 of our outstanding common stock, through March 1,
2015. In September 2014, our Board of Directors authorized a new program to repurchase up to $1,000 of our outstanding common stock,
through March 1, 2016, in addition to the remaining amount available for repurchase under previously authorized programs. During 2014, we
repurchased 8.9 shares of our common stock for an aggregate purchase price of $595 and had $1,075 remaining in share repurchase
capacity as of January 31, 2015. The actual number and timing of future share repurchases, if any, will be subject to market and economic
conditions and applicable SEC rules.
Dividends
In 2014, we paid dividends of $251, or $1.32 per share, compared with $234, or $1.20 per share, in 2013 and $220, or $1.08 per share, in
2012. During the first quarter of 2014, we increased our quarterly dividend from $0.30 per share to $0.33 per share. In determining the
amount of dividends to pay, we analyze our dividend payout ratio and dividend yield, while taking into consideration our current and projected
operating performance and liquidity. Our dividend payout ratio target range is 30% to 35% and is calculated as our dividend payments
divided by net earnings.
In February 2015, we declared a quarterly dividend of $0.37 per share, increased from a quarterly dividend of $0.33 per share in 2014.
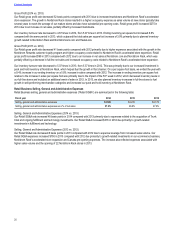
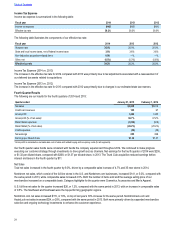
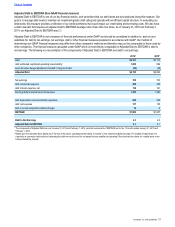
Free Cash Flow (Non-GAAP financial measure)
Free Cash Flow is one of our key liquidity measures, and when used in conjunction with GAAP measures, provides investors with a
meaningful analysis of our ability to generate cash from our business. For the year ended January 31, 2015, Free Cash Flow decreased to
$96 compared with $324 for the year ended February 1, 2014, primarily due to a decrease in cash provided by operating activities and an
increase in capital investments.
Free Cash Flow is not a measure of financial performance under GAAP and should be considered in addition to, and not as a substitute for,
operating cash flows or other financial measures prepared in accordance with GAAP. Our method of determining non-GAAP financial
measures may differ from other companies’ methods and therefore may not be comparable to those used by other companies. The financial
measure calculated under GAAP which is most directly comparable to Free Cash Flow is net cash provided by operating activities. The
following is a reconciliation of net cash provided by operating activities to Free Cash Flow:
Fiscal year 2014 2013
Net cash provided by operating activities $1,220 $1,320
Less: capital expenditures (861) (803)
Less: cash dividends paid (251) (234)
Less: change in credit card receivables originated at third parties (8) (6)
(Less) Add: change in cash book overdrafts (4) 47
Free Cash Flow $96 $324
Net cash used in investing activities ($889) ($822)
Net cash used in financing activities ($698) ($589)
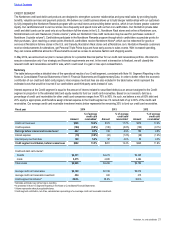
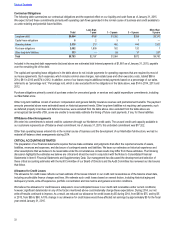
Credit Capacity and Commitments
As of January 31, 2015, we had total short-term borrowing capacity available for general corporate purposes of $800, which is our five-year
$800 senior unsecured revolving credit facility (“revolver”) that expires in March 2018. Under the terms of our revolver, we pay a variable rate
of interest and a commitment fee based on our debt rating. The revolver is available for working capital, capital expenditures and general
corporate purposes and backs our commercial paper program. We have the option to increase the revolving commitment by up to $200, to a
total of $1,000, provided that we obtain written consent from the lenders.
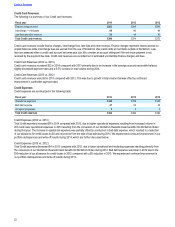
Our $800 commercial paper program allows us to use the proceeds to fund operating cash requirements. Under the terms of the commercial
paper agreement, we pay a rate of interest based on, among other factors, the maturity of the issuance and market conditions. The issuance
of commercial paper has the effect, while it is outstanding, of reducing borrowing capacity under our revolver by an amount equal to the
principal amount of commercial paper.
During 2014 and 2013, we had no issuances under our commercial paper program and no borrowings under our revolver.
In November 2013, our wholly owned subsidiary in Puerto Rico entered into a $52 unsecured borrowing facility that expires in November
2018 to support our expansion into that market. As of January 31, 2015, we had $37 outstanding on this facility.