Nordstrom 2014 Annual Report Download - page 15
Download and view the complete annual report
Please find page 15 of the 2014 Nordstrom annual report below. You can navigate through the pages in the report by either clicking on the pages listed below, or by using the keyword search tool below to find specific information within the annual report.-
 1
1 -
2
-
3
-
4
-
 5
5 -
 6
6 -
 7
7 -
 8
8 -
 9
9 -
 10
10 -
 11
11 -
 12
12 -
 13
13 -
 14
14 -
 15
15 -
 16
16 -
 17
17 -
 18
18 -
 19
19 -
 20
20 -
 21
21 -
 22
22 -
 23
23 -
 24
24 -
 25
25 -
26
-
27
-
28
-
29
-
30
-
31
-
32
-
33
-
34
-
35
-
36
-
37
-
38
-
39
-
40
-
41
-
42
-
43
-
44
-
45
-
46
-
47
-
48
-
49
-
50
-
51
-
52
-
53
-
54
-
55
-
56
-
57
-
58
-
59
-
60
-
61
-
62
-
63
-
64
-
65
-
66
-
67
-
68
-
69
-
70
-
71
-
72
-
73
-
74
-
75
-
76
-
77
-
78
 |
 |

Table of Contents
Nordstrom, Inc. and subsidiaries 15
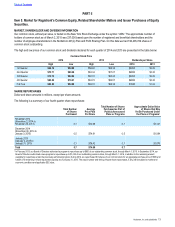
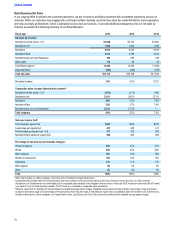
Item 6. Selected Financial Data.
Dollars in millions except per square foot and per share amounts
The following selected financial data are derived from the audited consolidated financial statements and should be read in conjunction with
Item 1A: Risk Factors, Item 7: Management’s Discussion and Analysis of Financial Condition and Results of Operations and the consolidated
financial statements and related notes included in Item 8: Financial Statements and Supplementary Data of this Annual Report on Form 10-K.
Fiscal year 2014 2013 2012 2011 2010
Earnings Results
Net sales $13,110 $12,166 $11,762 $10,497 $9,310
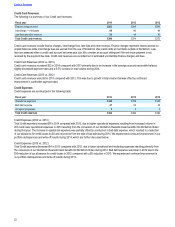
Credit card revenues 396 374 372 363 365
Gross profit14,704 4,429 4,330 3,905 3,413
Selling, general and administrative (“SG&A”) expenses (3,777) (3,453) (3,357) (3,019) (2,660)
Earnings before interest and income taxes (“EBIT”) 1,323 1,350 1,345 1,249 1,118
Net earnings 720 734 735 683 613
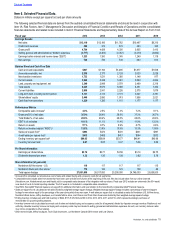
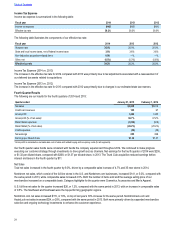
Balance Sheet and Cash Flow Data
Cash and cash equivalents $827 $1,194 $1,285 $1,877 $1,506
Accounts receivable, net 2,306 2,177 2,129 2,033 2,026
Merchandise inventories 1,733 1,531 1,360 1,148 977
Current assets 5,224 5,228 5,081 5,560 4,824
Land, property and equipment, net 3,340 2,949 2,579 2,469 2,318
Total assets 9,245 8,574 8,089 8,491 7,462
Current liabilities 2,800 2,541 2,226 2,575 1,879
Long-term debt, including current portion 3,131 3,113 3,131 3,647 2,781
Shareholders’ equity 2,440 2,080 1,913 1,956 2,021
Cash flow from operations 1,220 1,320 1,110 1,177 1,177
Performance Metrics
Comparable sales increase24.0%2.5% 7.3% 7.2% 8.1%
Gross profit % of net sales 35.9%36.4% 36.8% 37.2% 36.7%
Total SG&A % of net sales 28.8%28.4% 28.5% 28.8% 28.6%
EBIT % of net sales 10.1%11.1% 11.4% 11.9% 12.0%
Return on assets 8.1%8.7% 8.9% 8.7% 8.6%
Return on invested capital (“ROIC”)312.6%13.6% 13.9% 13.3% 13.6%
Sales per square foot4$493 $474 $470 $431 $397
4-wall sales per square foot4$413 $408 $417 $394 $372
Ending inventory per square foot5$64.05 $58.84 $53.77 $46.41 $40.96
Inventory turnover rate64.67 5.07 5.37 5.56 5.56
Per Share Information
Earnings per diluted share $3.72 $3.71 $3.56 $3.14 $2.75
Dividends declared per share 1.32 1.20 1.08 0.92 0.76
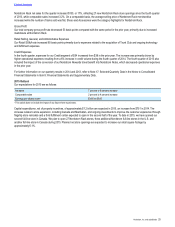
Store Information (at year-end)
Nordstrom full-line stores - U.S. 116 117 117 117 115
Nordstrom Rack and other stores7176 143 123 108 89
Total square footage 27,061,000 26,017,000 25,290,000 24,745,000 23,838,000
1 Gross profit is calculated as net sales less cost of sales and related buying and occupancy costs (for all segments).
2 Comparable sales include sales from stores that have been open at least one full year at the beginning of the year. We also include sales from our online channels
(Nordstrom.com, Nordstromrack.com and HauteLook) in comparable sales because of the integration with our stores. Fiscal year 2012 includes an extra week (the 53rd week)
as a result of our 4-5-4 retail reporting calendar. The 53rd week is not included in comparable sales calculations.
3 See ROIC (Non-GAAP financial measure) on page 26 for additional information and reconciliation to the most directly comparable GAAP financial measure.
4 Sales per square foot is calculated as net sales divided by weighted-average square footage. Weighted-average square footage includes a percentage of year-end square
footage for new stores equal to the percentage of the year during which they were open. 4-wall sales per square foot is calculated as sales for Nordstrom U.S. full-line stores,
Nordstrom Rack stores, Jeffrey boutiques, our Canada full-line store, Last Chance and Trunk Club showrooms divided by their weighted-average square footage.
5 Ending inventory includes pack and hold inventory of $222, $173, $125, $34 and $0 in 2014, 2013, 2012, 2011 and 2010, which represents strategic purchases of
merchandise for upcoming selling seasons.
6 Inventory turnover rate is calculated as annual cost of sales and related buying and occupancy costs (for all segments) divided by 4-quarter average inventory. Retailers do not
uniformly calculate inventory turnover as buying and occupancy costs may be included in selling, general and administrative expenses. As such, our inventory turnover rates
may not be comparable to other retailers.
7 Other stores include Jeffrey boutiques, Trunk Club showrooms, our Nordstrom Canada full-line store and Last Chance.