Nordstrom 2014 Annual Report Download - page 19
Download and view the complete annual report
Please find page 19 of the 2014 Nordstrom annual report below. You can navigate through the pages in the report by either clicking on the pages listed below, or by using the keyword search tool below to find specific information within the annual report.-
 1
1 -
2
-
3
-
4
-
5
-
6
-
7
-
8
-
 9
9 -
 10
10 -
 11
11 -
 12
12 -
 13
13 -
 14
14 -
 15
15 -
 16
16 -
 17
17 -
 18
18 -
 19
19 -
 20
20 -
 21
21 -
 22
22 -
 23
23 -
 24
24 -
 25
25 -
 26
26 -
 27
27 -
 28
28 -
 29
29 -
30
-
31
-
32
-
33
-
34
-
35
-
36
-
37
-
38
-
39
-
40
-
41
-
42
-
43
-
44
-
45
-
46
-
47
-
48
-
49
-
50
-
51
-
52
-
53
-
54
-
55
-
56
-
57
-
58
-
59
-
60
-
61
-
62
-
63
-
64
-
65
-
66
-
67
-
68
-
69
-
70
-
71
-
72
-
73
-
74
-
75
-
76
-
77
-
78
 |
 |

Table of Contents
Nordstrom, Inc. and subsidiaries 19
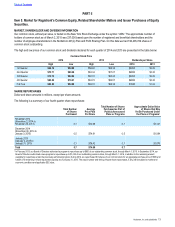
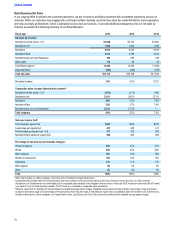
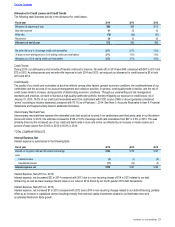
Net Sales (2014 vs. 2013)
In 2014, total company net sales increased 7.8%, which was attributable to the comparable sales increase of 4.0%. During the year, we
opened three Nordstrom full-line stores, including our first store in Canada, and 27 Nordstrom Rack stores. Additionally, as a result of the
acquisition of Trunk Club, we acquired four Trunk Club showrooms and opened one additional Trunk Club showroom in 2014. These
additions increased our square footage by 5.5% and represented 2.8% of our total net sales for 2014.
Nordstrom net sales, which consist of the U.S. full-line and Nordstrom.com businesses, were $9,678 in 2014, an increase of 3.8% compared
with 2013, with comparable sales up 3.6%. These increases reflected continued momentum in our Nordstrom.com channel. Both the number
of items sold and the average selling price increased on a comparable basis in 2014. Category highlights included Accessories, Cosmetics
and Men’s Apparel.
U.S. full-line net sales for 2014 were $7,682, a decrease of 0.3% compared with 2013 and comparable sales decreased by 0.5%. The top-
performing geographic regions for full-line stores were the Southeast and Southwest.
Our Nordstrom.com, Nordstromrack.com and HauteLook channels continued to experience outsized growth. Nordstrom.com net sales
increased 23% and Nordstromrack.com and HauteLook net sales increased 22%, both driven by expanded merchandise selection and
ongoing technology investments to enhance the customer experience.
Nordstrom Rack net sales increased $477, or 17%, compared with 2013, reflecting incremental volume from existing stores and the impact of
27 new stores since fiscal 2013. Comparable sales increased 3.8% for the year. Shoes and Accessories were the top-performing categories
for the year. On a comparable basis, the average selling price of Nordstrom Rack merchandise increased while the number of items sold was
flat.
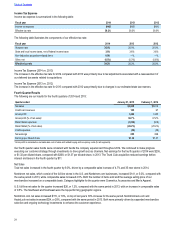
Net Sales (2013 vs. 2012)
Net sales for 2013 increased 3.4% compared with 2012, driven by a comparable sales increase of 2.5%, attributable to growth at
Nordstrom.com and Nordstrom Rack’s accelerated store expansion. During 2013, we opened 22 Nordstrom Rack stores and relocated one
Nordstrom full-line store and two Nordstrom Rack stores. These additions represented 1.6% of our total net sales for 2013 and increased our
square footage by 2.9%. The 53rd week in 2012 contributed approximately $162 in additional net sales.
Nordstrom net sales for 2013 were $9,327, an increase of 1.0% compared with 2012, with comparable sales up 2.3%. Strong growth at
Nordstrom.com was partially offset by sales decreases at our full-line stores. Both the average selling price and the number of items sold
increased on a comparable basis in 2013 compared with 2012. Category highlights included Cosmetics, Men’s Shoes and Women’s Apparel.
Full-line net sales for 2013 were $7,705, a decrease of 3.3% compared with 2012, which was primarily driven by a comparable sales
decrease of 2.1% for the year. The top-performing geographic regions for full-line stores for 2013 were the Southwest and Southeast.
Nordstrom.com showed strong sales growth with net sales of $1,622, an increase of 28% compared with 2012, with comparable sales up
30% on a comparable 52-week basis. These increases were driven by expanded merchandise selection and ongoing technology
investments to enhance the customer experience.
Nordstrom Rack net sales were $2,738, up 12.0% compared with 2012, primarily due to 37 new store openings in 2012 and 2013.
Comparable sales increased 2.7% for the year. Cosmetics and Shoes were the strongest-performing categories for the year. Both the
average selling price and the number of items sold increased on a comparable basis in 2013 compared with 2012.
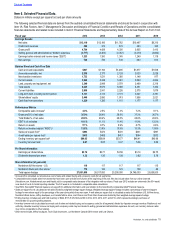
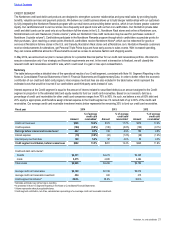
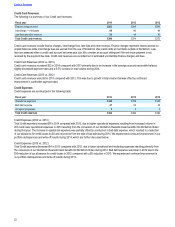
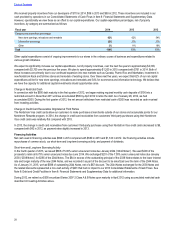
Retail Business Gross Profit
The following table summarizes the Retail Business gross profit:
Fiscal year 2014 2013 2012
Retail gross profit1$4,709 $4,434 $4,335
Retail gross profit as a % of net sales 35.9% 36.4% 36.9%
Ending inventory per square foot2$64.05 $58.84 $53.77
Inventory turnover rate34.67 5.07 5.37
1 Retailers do not uniformly record the costs of buying and occupancy and supply chain operations (freight, purchasing, receiving, distribution, etc.) between gross profit and
selling, general and administrative expense. As such, our gross profit and selling, general and administrative expenses and rates may not be comparable to other retailers’
expenses and rates.
2 Ending inventory includes pack and hold inventory of $222, $173 and $125 in 2014, 2013 and 2012, which represents strategic purchases of merchandise for upcoming selling
seasons.
3 Inventory turnover rate is calculated as annual cost of sales and related buying and occupancy costs (for all segments) divided by 4-quarter average inventory. Retailers do not
uniformly calculate inventory turnover as buying and occupancy costs may be included in selling, general and administrative expenses. As such, our inventory turnover rates
may not be comparable to other retailers.