Nordstrom 2014 Annual Report Download - page 24
Download and view the complete annual report
Please find page 24 of the 2014 Nordstrom annual report below. You can navigate through the pages in the report by either clicking on the pages listed below, or by using the keyword search tool below to find specific information within the annual report.-
 1
1 -
2
-
3
-
4
-
5
-
6
-
7
-
8
-
9
-
10
-
11
-
12
-
13
-
 14
14 -
 15
15 -
 16
16 -
 17
17 -
 18
18 -
 19
19 -
 20
20 -
 21
21 -
 22
22 -
 23
23 -
 24
24 -
 25
25 -
 26
26 -
 27
27 -
 28
28 -
 29
29 -
 30
30 -
 31
31 -
 32
32 -
 33
33 -
 34
34 -
35
-
36
-
37
-
38
-
39
-
40
-
41
-
42
-
43
-
44
-
45
-
46
-
47
-
48
-
49
-
50
-
51
-
52
-
53
-
54
-
55
-
56
-
57
-
58
-
59
-
60
-
61
-
62
-
63
-
64
-
65
-
66
-
67
-
68
-
69
-
70
-
71
-
72
-
73
-
74
-
75
-
76
-
77
-
78
 |
 |
Table of Contents
24
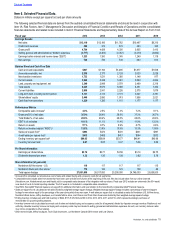
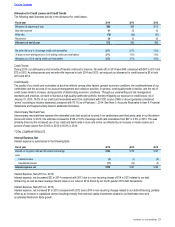
Income Tax Expense
Income tax expense is summarized in the following table:
Fiscal year 2014 2013 2012
Income tax expense $465 $455 $450
Effective tax rate 39.2% 38.3% 38.0%
The following table illustrates the components of our effective tax rate:
Fiscal year 2014 2013 2012
Statutory rate 35.0% 35.0% 35.0%
State and local income taxes, net of federal income taxes 3.8% 3.6% 3.6%
Non-deductible acquisition-related items 0.9% —% —%
Other, net (0.5%) (0.3%) (0.6%)
Effective tax rate 39.2% 38.3% 38.0%
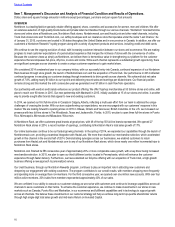
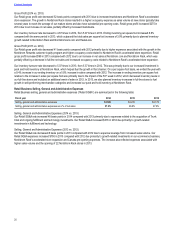
Income Tax Expense (2014 vs. 2013)
The increase in the effective tax rate for 2014 compared with 2013 was primarily due to tax adjustments associated with a reassessment of
our deferred tax assets related to acquisitions.
Income Tax Expense (2013 vs. 2012)
The increase in the effective tax rate for 2013 compared with 2012 was primarily due to changes in our estimated state tax reserves.
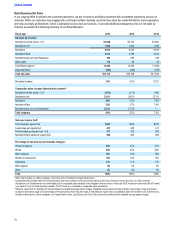
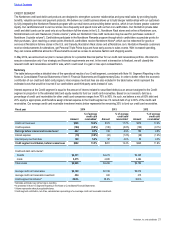
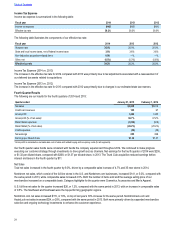
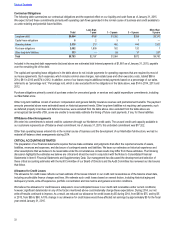
Fourth Quarter Results
The following are our results for the fourth quarters of 2014 and 2013:
Quarter ended January 31, 2015 February 1, 2014
Net sales $3,938 $3,614
Credit card revenues 105 97
Gross profit11,444 1,345
Gross profit (% of net sales)136.7% 37.2%
Retail SG&A expenses (1,032) (918)
Retail SG&A (% of net sales) (26.2%) (25.4%)
Credit expenses (54) (38)
Net earnings 255 268
Earnings per diluted share $1.32 $1.37
1 Gross profit is calculated as net sales less cost of sales and related buying and occupancy costs (for all segments).
Our fourth quarter sales trends were consistent with trends the company experienced throughout 2014. We continued to make progress
executing our customer strategy through investments to drive growth across channels. Net earnings for the fourth quarter of 2014 were $255,
or $1.32 per diluted share, compared with $268, or $1.37 per diluted share, in 2013. The Trunk Club acquisition reduced earnings before
interest and taxes in the fourth quarter by $11.
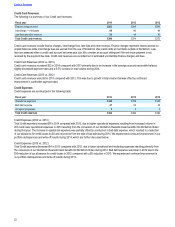
Net Sales
Total net sales increased in the fourth quarter by 9.0%, driven by a comparable sales increase of 4.7% and 35 new stores in 2014.
Nordstrom net sales, which consist of the full-line stores in the U.S. and Nordstrom.com businesses, increased $141, or 5.0%, compared with
the same period in 2013, while comparable sales increased 4.5%. Both the number of items sold and the average selling price of our
merchandise increased on a comparable basis. Category highlights for the quarter were Cosmetics, Accessories and Men’s Apparel.
U.S. full-line net sales for the quarter increased $26, or 1.2%, compared with the same period in 2013, with an increase in comparable sales
of 0.5%. The Southwest and Southeast were the top-performing geographic regions.
Nordstrom.com net sales increased $115, or 19%, on top of last year’s 30% increase for the same period. Nordstromrack.com and
HauteLook net sales increased $24, or 28%, compared with the same period in 2013. Both were primarily driven by expanded merchandise
selection and ongoing technology investments to enhance the customer experience.