Nordstrom 2014 Annual Report Download - page 27
Download and view the complete annual report
Please find page 27 of the 2014 Nordstrom annual report below. You can navigate through the pages in the report by either clicking on the pages listed below, or by using the keyword search tool below to find specific information within the annual report.-
 1
1 -
2
-
3
-
4
-
5
-
6
-
7
-
8
-
9
-
10
-
11
-
12
-
13
-
14
-
15
-
16
-
 17
17 -
 18
18 -
 19
19 -
 20
20 -
 21
21 -
 22
22 -
 23
23 -
 24
24 -
 25
25 -
 26
26 -
 27
27 -
 28
28 -
 29
29 -
 30
30 -
 31
31 -
 32
32 -
 33
33 -
 34
34 -
 35
35 -
 36
36 -
 37
37 -
38
-
39
-
40
-
41
-
42
-
43
-
44
-
45
-
46
-
47
-
48
-
49
-
50
-
51
-
52
-
53
-
54
-
55
-
56
-
57
-
58
-
59
-
60
-
61
-
62
-
63
-
64
-
65
-
66
-
67
-
68
-
69
-
70
-
71
-
72
-
73
-
74
-
75
-
76
-
77
-
78
 |
 |

Table of Contents
Nordstrom, Inc. and subsidiaries 27
LIQUIDITY AND CAPITAL RESOURCES
We strive to maintain a level of liquidity sufficient to allow us to cover our seasonal cash needs and to maintain appropriate levels of short-
term borrowings. We believe that our operating cash flows, available credit facilities and potential future borrowings are sufficient to finance
our cash requirements for the next 12 months and beyond.
Over the long term, we manage our cash and capital structure to maximize shareholder return, maintain our financial position, manage
refinancing risk and allow flexibility for strategic initiatives. We regularly assess our debt and leverage levels, capital expenditure
requirements, debt service payments, dividend payouts, potential share repurchases and other future investments. We believe that as of
January 31, 2015, our existing cash and cash equivalents on-hand of $827, available credit facilities of $800 and potential future operating
cash flows and borrowings will be sufficient to fund these scheduled future payments and potential long-term initiatives. Additionally, if an
agreement is reached and a transaction is consummated in regards to our credit card receivables, it could result in additional cash flows to
further support our capital requirements and strategic initiatives.
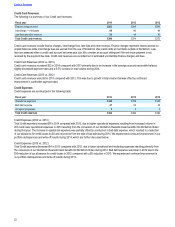
Operating Activities
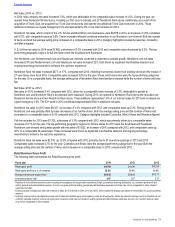
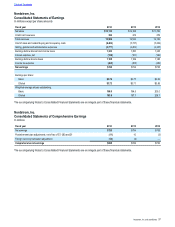
Net cash provided by operating activities was $1,220 in 2014, $1,320 in 2013 and $1,110 in 2012. The majority of our operating cash inflows
are derived from sales. We also receive cash payments for property incentives from developers. Our operating cash outflows generally
consist of payments to our merchandise vendors (net of vendor allowances), payments to our employees for wages, salaries and other
employee benefits and payments to our landlords for rent. Operating cash outflows also include payments for income taxes and interest
payments on our short-term and long-term borrowings.
Cash provided by operating activities decreased in 2014 compared with 2013, which was primarily due to higher state tax payments made in
2014 compared with 2013, as well as changes in working capital in 2014.
Cash provided by operating activities increased in 2013 compared with 2012, resulting from less state tax payments made in 2013 due to
additional payments made in 2012 as a result of the 53rd week, along with increased property incentives received from developers and
changes in working capital.
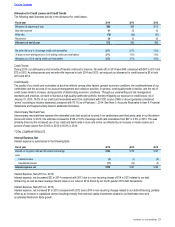
Investing Activities
Net cash used in investing activities was $889 in 2014, $822 in 2013 and $369 in 2012. Our investing cash flows primarily consist of capital
expenditures, changes in restricted cash accumulated for debt maturities and changes in credit card receivables associated with cardholder
purchases outside of Nordstrom using our Nordstrom Visa credit cards.
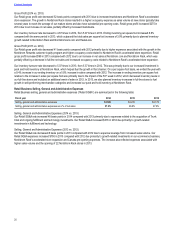
Capital Expenditures
Our capital expenditures over the last three years totaled $2,177, with $861 in 2014, $803 in 2013 and $513 in 2012. Capital expenditures
increased in 2014 compared with 2013 primarily due to ongoing store expansion and increased technology investments.
Capital expenditures increased in 2013 compared with 2012 as we continued to make progress executing our customer strategy through
increased investments in technology, ecommerce, remodels and new stores, including Nordstrom Rack and our Manhattan full-line store.
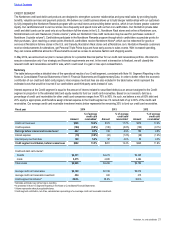
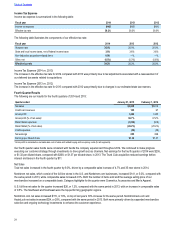
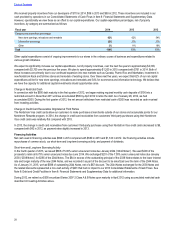
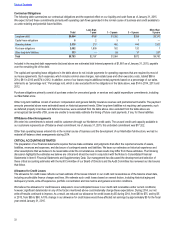
The following table summarizes our store count and square footage activity:
Store count Square footage
Fiscal year 2014 2013 2012 2014 2013 2012
Total, beginning of year 260 240 225 26.0 25.3 24.7
Store openings:
Nordstrom full-line stores - U.S. 2— 1 0.3 — 0.1
Nordstrom Rack and other stores129 22 15 1.2 0.7 0.6
Stores acquired 4— — ——
Stores closed (3) (2) (1) (0.4) — (0.1)
Total, end of year 292 260 240 27.1 26.0 25.3
1 Other stores include Jeffrey boutiques, Trunk Club showrooms, our Nordstrom Canada full-line store and Last Chance.
We had no store relocations in 2014, compared with one Nordstrom full-line store and two Nordstrom Rack relocations in 2013 and three
Nordstrom Rack relocations in 2012. Our 2014 new store openings increased our square footage by 5.5%.
To date in 2015, we have opened our second full-line store in Canada. We plan to open 27 Nordstrom Rack stores, three additional
Nordstrom full-line stores in the U.S. and another full-line store in Canada during 2015. Planned net store openings are expected to increase
our retail square footage by approximately 6.1%.