Nordstrom 2014 Annual Report Download - page 25
Download and view the complete annual report
Please find page 25 of the 2014 Nordstrom annual report below. You can navigate through the pages in the report by either clicking on the pages listed below, or by using the keyword search tool below to find specific information within the annual report.-
 1
1 -
2
-
3
-
4
-
5
-
6
-
7
-
8
-
9
-
10
-
11
-
12
-
13
-
14
-
 15
15 -
 16
16 -
 17
17 -
 18
18 -
 19
19 -
 20
20 -
 21
21 -
 22
22 -
 23
23 -
 24
24 -
 25
25 -
 26
26 -
 27
27 -
 28
28 -
 29
29 -
 30
30 -
 31
31 -
 32
32 -
 33
33 -
 34
34 -
 35
35 -
36
-
37
-
38
-
39
-
40
-
41
-
42
-
43
-
44
-
45
-
46
-
47
-
48
-
49
-
50
-
51
-
52
-
53
-
54
-
55
-
56
-
57
-
58
-
59
-
60
-
61
-
62
-
63
-
64
-
65
-
66
-
67
-
68
-
69
-
70
-
71
-
72
-
73
-
74
-
75
-
76
-
77
-
78
 |
 |

Table of Contents
Nordstrom, Inc. and subsidiaries 25
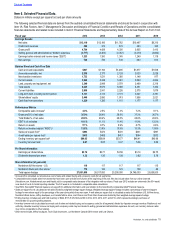
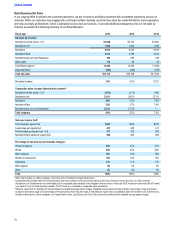
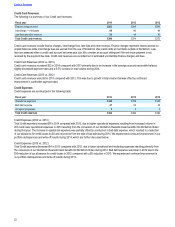
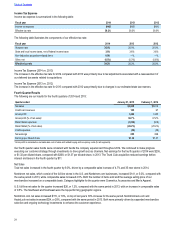
Nordstrom Rack net sales for the quarter increased $130, or 17%, reflecting 27 new Nordstrom Rack store openings since the fourth quarter
of 2013, while comparable sales increased 3.2%. On a comparable basis, the average selling price of Nordstrom Rack merchandise
increased while the number of items sold was flat. Shoes and Accessories were the category highlights for Nordstrom Rack.
Gross Profit
Our total company gross profit rate decreased 53 basis points compared with the same period in the prior year, primarily due to increased
markdowns at Nordstrom Rack.
Retail Selling, General, and Administrative Expenses
Our Retail SG&A rate increased 80 basis points primarily due to expenses related to the acquisition of Trunk Club and ongoing technology
and fulfillment expenses.
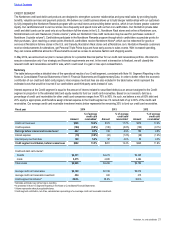
Credit Expenses
In the fourth quarter, expenses for our Credit segment of $54 increased from $38 in the prior year. The increase was primarily driven by
higher operational expenses resulting from a 6% increase in credit volume during the fourth quarter of 2014. The fourth quarter of 2013 also
included the impact of the conversion of our Nordstrom Rewards travel benefit into Nordstrom Notes, which decreased operational expenses
in the prior year.
For further information on our quarterly results in 2014 and 2013, refer to Note 17: Selected Quarterly Data in the Notes to Consolidated
Financial Statements in Item 8: Financial Statements and Supplementary Data.
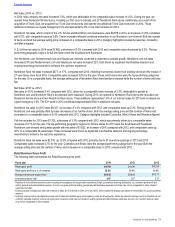
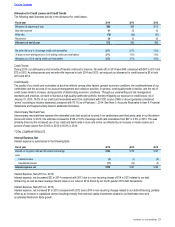
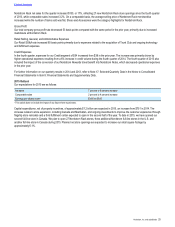
2015 Outlook
Our expectations for 2015 are as follows:
Net sales 7 percent to 9 percent increase
Comparable sales 2 percent to 4 percent increase
Earnings per diluted share1$3.65 to $3.80
1 This outlook does not include the impact of any future share repurchases.
Capital expenditures, net of property incentives, of approximately $1.2 billion are expected in 2015, an increase from $751 in 2014. The
increase relates to store expansion, including Canada and Manhattan, and ongoing investments to improve the customer experience through
flagship store remodels and a third fulfillment center expected to open in the second half of the year. To date in 2015, we have opened our
second full-line store in Canada. We plan to open 27 Nordstrom Rack stores, three additional Nordstrom full-line stores in the U.S. and
another full-line store in Canada during 2015. Planned net store openings are expected to increase our retail square footage by
approximately 6.1%.