Nordstrom 2014 Annual Report Download - page 20
Download and view the complete annual report
Please find page 20 of the 2014 Nordstrom annual report below. You can navigate through the pages in the report by either clicking on the pages listed below, or by using the keyword search tool below to find specific information within the annual report.-
 1
1 -
2
-
3
-
4
-
5
-
6
-
7
-
8
-
9
-
 10
10 -
 11
11 -
 12
12 -
 13
13 -
 14
14 -
 15
15 -
 16
16 -
 17
17 -
 18
18 -
 19
19 -
 20
20 -
 21
21 -
 22
22 -
 23
23 -
 24
24 -
 25
25 -
 26
26 -
 27
27 -
 28
28 -
 29
29 -
 30
30 -
31
-
32
-
33
-
34
-
35
-
36
-
37
-
38
-
39
-
40
-
41
-
42
-
43
-
44
-
45
-
46
-
47
-
48
-
49
-
50
-
51
-
52
-
53
-
54
-
55
-
56
-
57
-
58
-
59
-
60
-
61
-
62
-
63
-
64
-
65
-
66
-
67
-
68
-
69
-
70
-
71
-
72
-
73
-
74
-
75
-
76
-
77
-
78
 |
 |

Table of Contents
20
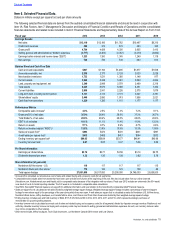
Gross Profit (2014 vs. 2013)
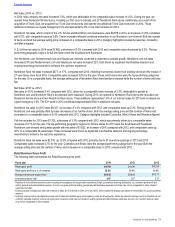
Our Retail gross profit rate decreased 52 basis points compared with 2013 due to increased markdowns and Nordstrom Rack’s accelerated
store expansion. The growth in Nordstrom Rack stores resulted in a higher occupancy expense as sales volume at new stores typically take
several years to reach the average of our mature stores and also have substantial pre-opening costs. Retail gross profit increased $275 in
2014 due to an increase in net sales, partially offset by increased markdowns.
Our inventory turnover rate decreased to 4.67 times in 2014, from 5.07 times in 2013. Ending inventory per square foot increased 8.8%
compared with the same period in 2013, which outpaced the total sales per square foot increase of 3.9% primarily due to planned inventory
growth related to Nordstrom Rack and Nordstromrack.com and HauteLook.
Gross Profit (2013 vs. 2012)
Our Retail gross profit rate decreased 41 basis points compared with 2012 primarily due to higher expenses associated with the growth in the
Nordstrom Rewards customer loyalty program and higher occupancy costs related to Nordstrom Rack’s accelerated store expansion. Retail
gross profit increased $99 in 2013 compared with 2012 due to an increase in net sales at Nordstrom.com and Nordstrom Rack, which was
partially offset by a decrease in full-line net sales and increased occupancy costs related to Nordstrom Rack’s accelerated store expansion.
Our inventory turnover rate decreased to 5.07 times in 2013, from 5.37 times in 2012. This was primarily due to our increased investment in
pack and hold inventory at Nordstrom Rack, which helped fuel the growth in that channel. On a per square foot basis, we ended the year with
a 9.4% increase in our ending inventory on a 0.8% increase in sales compared with 2012. The increase in ending inventory per square foot
relative to the increase in sales per square foot was primarily due to the impact of the 53rd week in 2012, which decreased inventory levels in
our full-line stores and included an additional week of sales in 2012. In 2013, we also planned inventory increases in full-line stores to fuel
growth in well-performing merchandise categories and increased our pack and hold inventory at Nordstrom Rack.
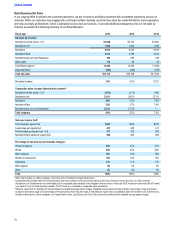
Retail Business Selling, General and Administrative Expenses
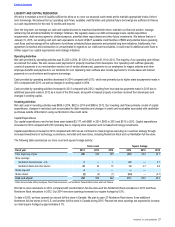
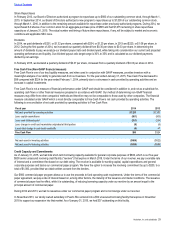
Retail Business selling, general and administrative expenses (“Retail SG&A”) are summarized in the following table:
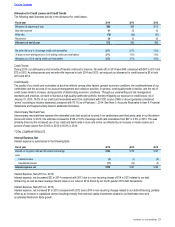
Fiscal year 2014 2013 2012
Selling, general and administrative expenses $3,588 $3,272 $3,172
Selling, general and administrative expenses as a % of net sales 27.4% 26.9% 27.0%
Selling, General and Administrative Expenses (2014 vs. 2013)
Our Retail SG&A rate increased 48 basis points in 2014 compared with 2013 primarily due to expenses related to the acquisition of Trunk
Club and ongoing fulfillment and technology investments. Our Retail SG&A increased $316 in 2014 due primarily to growth-related
investments in fulfillment and technology.
Selling, General and Administrative Expenses (2013 vs. 2012)
Our Retail SG&A rate decreased 8 basis points in 2013 compared with 2012 due to expense leverage from increased sales volume. Our
Retail SG&A expenses increased $100 in 2013 compared with 2012 due primarily to growth-related investments in our ecommerce business,
Nordstrom Rack’s accelerated store expansion and Canada pre-opening expenses. The increase also reflected expenses associated with
higher sales volume and the opening of 22 Nordstrom Rack stores in 2013.