Nordstrom 2014 Annual Report Download - page 18
Download and view the complete annual report
Please find page 18 of the 2014 Nordstrom annual report below. You can navigate through the pages in the report by either clicking on the pages listed below, or by using the keyword search tool below to find specific information within the annual report.-
 1
1 -
2
-
3
-
4
-
5
-
6
-
7
-
 8
8 -
 9
9 -
 10
10 -
 11
11 -
 12
12 -
 13
13 -
 14
14 -
 15
15 -
 16
16 -
 17
17 -
 18
18 -
 19
19 -
 20
20 -
 21
21 -
 22
22 -
 23
23 -
 24
24 -
 25
25 -
 26
26 -
 27
27 -
 28
28 -
29
-
30
-
31
-
32
-
33
-
34
-
35
-
36
-
37
-
38
-
39
-
40
-
41
-
42
-
43
-
44
-
45
-
46
-
47
-
48
-
49
-
50
-
51
-
52
-
53
-
54
-
55
-
56
-
57
-
58
-
59
-
60
-
61
-
62
-
63
-
64
-
65
-
66
-
67
-
68
-
69
-
70
-
71
-
72
-
73
-
74
-
75
-
76
-
77
-
78
 |
 |
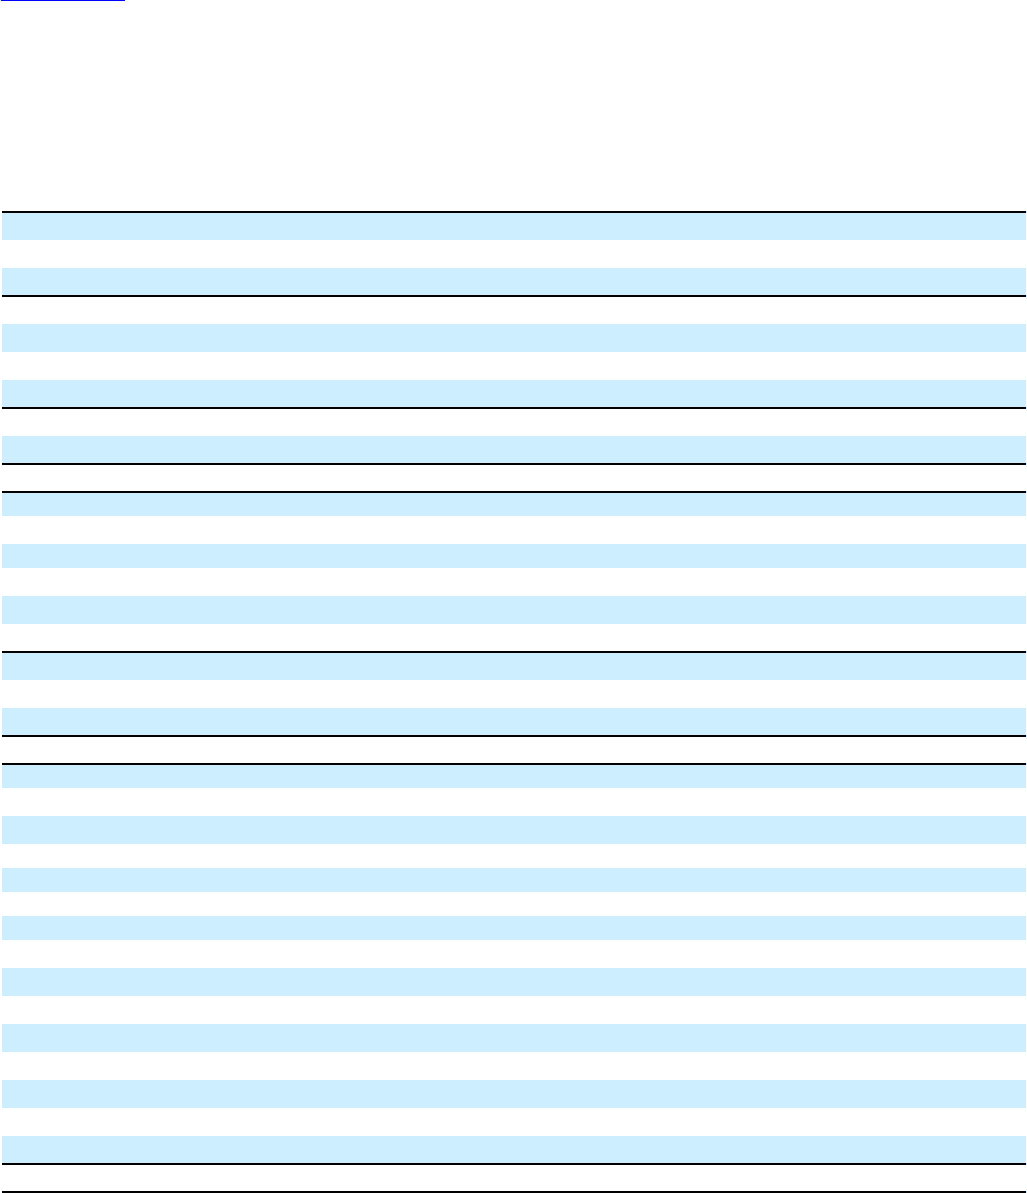
Table of Contents
18
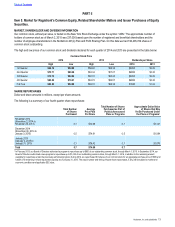
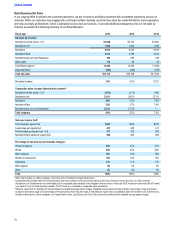
Retail Business Net Sales
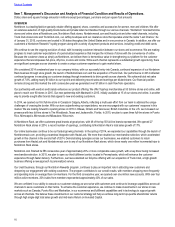
In our ongoing effort to enhance the customer experience, we are focused on providing customers with a seamless experience across our
channels. While our customers may engage with us through multiple channels, we know they value the overall Nordstrom brand experience
and view us simply as Nordstrom, which is ultimately how we view our business. To provide additional transparency into our net sales by
channel, we present the following summary of our Retail Business:
Fiscal year 2014 2013 2012
Net sales by channel:
Nordstrom full-line stores - U.S. $7,682 $7,705 $7,964
Nordstrom.com 1,996 1,622 1,269
Nordstrom 9,678 9,327 9,233
Nordstrom Rack 3,215 2,738 2,445
Nordstromrack.com and HauteLook 360 295 236
Other retail1116 35 35
Total Retail segment 13,369 12,395 11,949
Corporate/Other (259) (229) (187)
Total net sales $13,110 $12,166 $11,762
Net sales increase 7.8% 3.4% 12.1%
Comparable sales increase (decrease) by channel2:
Nordstrom full-line stores - U.S. (0.5%) (2.1%) 3.9%
Nordstrom.com 23.1% 29.5% 37.1%
Nordstrom 3.6% 2.3% 7.5%
Nordstrom Rack 3.8% 2.7% 7.4%
Nordstromrack.com and HauteLook 22.1% 27.3% —
Total company 4.0% 2.5% 7.3%
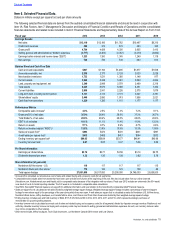
Sales per square foot3:
Total sales per square foot $493 $474 $470
4-wall sales per square foot 413 408 417
Full-line sales per square foot - U.S. 371 372 385
Nordstrom Rack sales per square foot 552 553 568
Percentage of net sales by merchandise category:
Women’s Apparel 30% 31% 31%
Shoes 23% 23% 23%
Men’s Apparel 16% 16% 16%
Women’s Accessories 14% 14% 13%
Cosmetics 11% 11% 11%
Kids’ Apparel 4% 3% 3%
Other 2% 2% 3%
Total 100% 100% 100%
1 Other retail includes our Jeffrey boutiques, Trunk Club and our Nordstrom Canada full-line store.
2 Comparable sales include sales from stores that have been open at least one full year at the beginning of the year. We also include sales from our online channels
(Nordstrom.com, Nordstromrack.com and HauteLook) in comparable sales because of the integration with our stores. Fiscal year 2012 includes an extra week (the 53rd week)
as a result of our 4-5-4 retail reporting calendar. The 53rd week is not included in comparable sales calculations.
3 Sales per square foot is calculated as net sales divided by weighted-average square footage. Weighted-average square footage includes a percentage of year-end square
footage for new stores equal to the percentage of the year during which they were open. 4-wall sales per square foot is calculated as sales for Nordstrom U.S. full-line stores,
Nordstrom Rack stores, Jeffrey boutiques, our Canada full-line store, Last Chance and Trunk Club showrooms divided by their weighted-average square footage.