Nordstrom 2009 Annual Report Download - page 66
Download and view the complete annual report
Please find page 66 of the 2009 Nordstrom annual report below. You can navigate through the pages in the report by either clicking on the pages listed below, or by using the keyword search tool below to find specific information within the annual report.-
 1
1 -
2
-
3
-
4
-
5
-
6
-
7
-
8
-
9
-
10
-
11
-
12
-
13
-
14
-
15
-
16
-
17
-
18
-
19
-
20
-
21
-
22
-
23
-
24
-
25
-
26
-
27
-
28
-
29
-
30
-
31
-
32
-
33
-
34
-
35
-
36
-
37
-
38
-
39
-
40
-
41
-
42
-
43
-
44
-
45
-
46
-
47
-
48
-
49
-
50
-
51
-
52
-
53
-
54
-
55
-
 56
56 -
 57
57 -
 58
58 -
 59
59 -
 60
60 -
 61
61 -
 62
62 -
 63
63 -
 64
64 -
 65
65 -
 66
66 -
 67
67 -
 68
68 -
 69
69 -
 70
70 -
 71
71 -
 72
72 -
 73
73 -
 74
74 -
 75
75 -
 76
76 -
77
-
78
-
79
-
80
-
81
-
82
-
83
-
84
 |
 |

58
Nordstrom, Inc.
Notes to Consolidated Financial Statements
Dollar and share amounts in millions except per share, per option and unit amounts
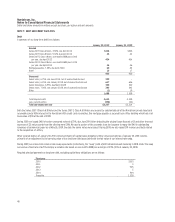
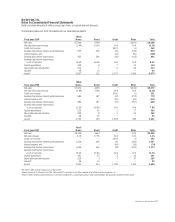
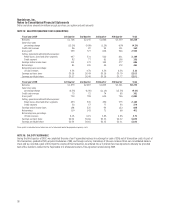
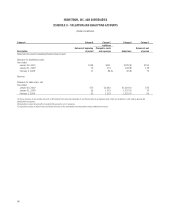
NOTE 15: SELECTED QUARTERLY DATA (UNAUDITED)
Fiscal year 2009 1st Quarter 2nd Quarter 3rd Quarter 4th Quarter Total
Net sales $1,706 $2,145 $1,868 $2,539 $8,258
Same-store sales
percentage change (13.2%) (9.8%) (1.2%) 6.9% (4.2%)
Credit card revenues 86 87 95 101 369
Gross profit1 599 727 658 946 2,930
Selling, general and administrative expenses:
Retail stores, direct and other segments 447 531 500 631 2,109
Credit segment 92 77 81 106 356
Earnings before income taxes 115 170 134 277 696
Net earnings 81 105 83 172 441
Net earnings as a percentage
of total revenues 4.5% 4.7% 4.2% 6.5% 5.1%
Earnings per basic share $0.38 $0.49 $0.38 $0.79 $2.03
Earnings per diluted share $0.37 $0.48 $0.38 $0.77 $2.01
Fiscal year 2008 1st Quarter 2nd Quarter 3rd Quarter 4th Quarter Total
Net sales $1,879 $2,287 $1,805 $2,301 $8,272
Same-store sales
percentage change (6.5%) (6.0%) (11.1%) (12.5%) (9.0%)
Credit card revenues 70 72 74 85 301
Gross profit1 700 799 620 736 2,855
Selling, general and administrative expenses:
Retail stores, direct and other segments 493 545 490 575 2,103
Credit segment 50 57 77 90 274
Earnings before income taxes 196 235 94 123 648
Net earnings 119 143 71 68 401
Net earnings as a percentage
of total revenues 6.1% 6.1% 3.8% 2.8% 4.7%
Earnings per basic share $0.54 $0.66 $0.33 $0.32 $1.85
Earnings per diluted share $0.54 $0.65 $0.33 $0.31 $1.83
1Gross profit is calculated as net sales less cost of sales and related buying and occupancy costs.
NOTE 16: SALE OF FAÇONNABLE
During the third quarter of 2007, we completed the sale of our Façonnable business in exchange for cash of $216, net of transaction costs. As part of
this transaction, goodwill of $28, acquired tradename of $84, and foreign currency translation of $16 were removed from our consolidated balance
sheet and we recorded a gain of $34. Upon the closing of this transaction, we entered into a Transition Services Agreement, whereby we provided
back office functions related to the Façonnable U.S. wholesale business. This agreement ended during 2009.