Nordstrom 2009 Annual Report Download - page 32
Download and view the complete annual report
Please find page 32 of the 2009 Nordstrom annual report below. You can navigate through the pages in the report by either clicking on the pages listed below, or by using the keyword search tool below to find specific information within the annual report.-
 1
1 -
2
-
3
-
4
-
5
-
6
-
7
-
8
-
9
-
10
-
11
-
12
-
13
-
14
-
15
-
16
-
17
-
18
-
19
-
20
-
21
-
 22
22 -
 23
23 -
 24
24 -
 25
25 -
 26
26 -
 27
27 -
 28
28 -
 29
29 -
 30
30 -
 31
31 -
 32
32 -
 33
33 -
 34
34 -
 35
35 -
 36
36 -
 37
37 -
 38
38 -
 39
39 -
 40
40 -
 41
41 -
 42
42 -
43
-
44
-
45
-
46
-
47
-
48
-
49
-
50
-
51
-
52
-
53
-
54
-
55
-
56
-
57
-
58
-
59
-
60
-
61
-
62
-
63
-
64
-
65
-
66
-
67
-
68
-
69
-
70
-
71
-
72
-
73
-
74
-
75
-
76
-
77
-
78
-
79
-
80
-
81
-
82
-
83
-
84
 |
 |

24
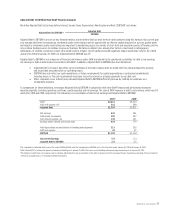
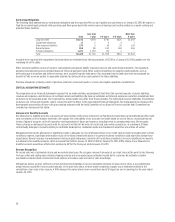
Return on Invested Capital (ROIC) (Non-GAAP financial measure)
We define Return on Invested Capital (ROIC) as follows:
We believe that ROIC is a useful financial measure for investors in evaluating our operating performance for the periods presented. When read in
conjunction with our net earnings and total assets and compared to return on assets, it provides investors with a useful tool to evaluate our ongoing
operations and our management of assets from period to period. ROIC is one of our key financial metrics, and we also incorporate it into our executive
incentive measures. Our research has shown that, historically, overall performance as measured by ROIC correlates directly to shareholders’ return
over the long term. For the 12 fiscal months ended January 30, 2010, our ROIC increased to 12.1% compared to 11.6% for the 12 fiscal months ended
January 31, 2009. ROIC is not a measure of financial performance under GAAP, should not be considered a substitute for return on assets, net earnings
or total assets as determined in accordance with GAAP, and may not be comparable to similarly titled measures reported by other companies. The
closest GAAP measure is return on assets, which increased slightly to 7.1% from 7.0% for the 12 fiscal months ended January 30, 2010 compared to the
12 fiscal months ended January 31, 2009. The following is a reconciliation of return on assets to ROIC:
12 fiscal months ended
January 30, 2010 January 31, 2009
Net earnings $441 $401
Add: income tax expense 255 247
Add: interest expense, net 138 131
Earnings before interest and income taxes 834 779
Add: rent expense 43 37
Less: estimated depreciation on capitalized
operating leases1 (23) (19)
Net operating profit 854 797
Estimated income tax expense2 (313) (303)
Net operating profit after tax (NOPAT) $541 $494
Average total assets3 $6,197 $5,768
Less: average non-interest-bearing current liabilities4 (1,562) (1,447)
Less: average deferred property incentives3 (462) (400)
Add: average estimated asset base of capitalized
operating leases5 311 322
Average invested capital $4,484 $4,243
Return on assets 7.1% 7.0%
ROIC 12.1% 11.6%
1Depreciation based upon estimated asset base of capitalized operating leases as described in footnote 5 below.
2Based upon our effective tax rate multiplied by the net operating profit for the fiscal years ended January 30, 2010 and January 31, 2009.
3Based upon the trailing 12-month average.
4Based upon the trailing 12-month average for accounts payable, accrued salaries, wages and related benefits, and other current liabilities.
5Based upon the trailing 12-month average of the monthly asset base, which is calculated as the trailing 12 months rent expense multiplied by 8.
Our ROIC increased primarily due to an increase in our earnings before interest and income taxes compared to the prior year, offset by an increase in
our average invested capital attributable primarily to growth in cash and cash equivalents.
Net Operating Profit After Taxes (NOPAT)
ROIC = Average Invested Capital