Nordstrom 2009 Annual Report Download - page 2
Download and view the complete annual report
Please find page 2 of the 2009 Nordstrom annual report below. You can navigate through the pages in the report by either clicking on the pages listed below, or by using the keyword search tool below to find specific information within the annual report.-
 1
1 -
 2
2 -
 3
3 -
 4
4 -
 5
5 -
 6
6 -
 7
7 -
 8
8 -
 9
9 -
 10
10 -
 11
11 -
 12
12 -
 13
13 -
14
-
15
-
16
-
17
-
18
-
19
-
20
-
21
-
22
-
23
-
24
-
25
-
26
-
27
-
28
-
29
-
30
-
31
-
32
-
33
-
34
-
35
-
36
-
37
-
38
-
39
-
40
-
41
-
42
-
43
-
44
-
45
-
46
-
47
-
48
-
49
-
50
-
51
-
52
-
53
-
54
-
55
-
56
-
57
-
58
-
59
-
60
-
61
-
62
-
63
-
64
-
65
-
66
-
67
-
68
-
69
-
70
-
71
-
72
-
73
-
74
-
75
-
76
-
77
-
78
-
79
-
80
-
81
-
82
-
83
-
84
 |
 |
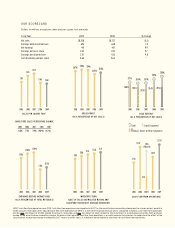
Dollars in millions except per share and per square foot amounts
Fiscal Year 2009 2008 % Change
Net sales $8,258 $8,272 (0.2)
Earnings before income taxes 696 648 7.4
Net earnings 441 401 9.9
Earnings per basic share 2.03 1.85 9.7
Earnings per diluted share 2.01 1.83 9.8
Cash dividends paid per share 0.64 0.64
†2007 cash flow from operations was $312. Cash flow from operations was impacted in 2007 by the securitization accounting change and, to a lesser extent, growth in
credit accounts receivable. 2007 adjusted cash flow from operations of $975 is a non-GAAP financial measure and is calculated as follows: cash flow from operations
of $312, plus the impact of $1,083 related to accounts receivable, and less the impact of $420 related to the investment in asset-backed securities, both primarily
related to the securitization accounting change. We believe that adjusted cash flow from operations is a useful measure for investors to understand the effect of the
securitization accounting change in comparing 2007 results to other years. It should not be considered a substitute for cash flow from operations.
36.7%
4.84
5.20
5.06 5.16 $848
$1,251
$776
$1,142 $975
(Adjusted)
7.6% 8.1%
11.3%
12.8% 12.9%
2005 2006
$392
$423
2007
$435
2008
$388
2009
2005 2006 2007 2008 2009
2005 2006 2007 2008 2009 2005 2006 2007 2008 2009
$368
34.5% 35.5%
37.5% 37.4%
6.0% 7.5% 3.9%
2005 2006 2007 2008
(9.0%)
2009
(4.2%)
27.1% 26.5% 26.7%
28.7%
Retail, Direct & Other Segments
5.41
2005 2006 2007 2008 2009 2005 2006 2007† 2008 2009
29.8%
$312
25.5
%
26.0
%
Total Credit Segment
25.5
%
24.5
%
25.4
%
SALES PER SQUARE FOOT
SAME-STORE SALES PERCENTAGE CHANGE
GROSS PROFIT
(AS A PERCENTAGE OF NET SALES)
SG&A EXPENSE
(AS A PERCENTAGE OF NET SALES)
EARNINGS BEFORE INCOME TAXES
(AS A PERCENTAGE OF TOTAL REVENUES)
INVENTORY TURN
(COST OF SALES AND RELATED BUYING AND
OCCUPANCY DIVIDED BY AVERAGE INVENTORY)
CASH FLOW FROM OPERATIONS
OUR SCORECARD
_