Nordstrom 2009 Annual Report Download - page 22
Download and view the complete annual report
Please find page 22 of the 2009 Nordstrom annual report below. You can navigate through the pages in the report by either clicking on the pages listed below, or by using the keyword search tool below to find specific information within the annual report.-
 1
1 -
2
-
3
-
4
-
5
-
6
-
7
-
8
-
9
-
10
-
11
-
 12
12 -
 13
13 -
 14
14 -
 15
15 -
 16
16 -
 17
17 -
 18
18 -
 19
19 -
 20
20 -
 21
21 -
 22
22 -
 23
23 -
 24
24 -
 25
25 -
 26
26 -
 27
27 -
 28
28 -
 29
29 -
 30
30 -
 31
31 -
 32
32 -
33
-
34
-
35
-
36
-
37
-
38
-
39
-
40
-
41
-
42
-
43
-
44
-
45
-
46
-
47
-
48
-
49
-
50
-
51
-
52
-
53
-
54
-
55
-
56
-
57
-
58
-
59
-
60
-
61
-
62
-
63
-
64
-
65
-
66
-
67
-
68
-
69
-
70
-
71
-
72
-
73
-
74
-
75
-
76
-
77
-
78
-
79
-
80
-
81
-
82
-
83
-
84
 |
 |

14
PART II
Item 5. Market for Registrant’s Common Equity, Related Shareholder Matters and Issuer Purchases of
Equity Securities.
MARKET, SHAREHOLDER AND DIVIDEND INFORMATION
Our common stock, without par value, is traded on the New York Stock Exchange under the symbol “JWN.” The approximate number of holders
of common stock as of March 12, 2010 was 134,493, based upon the number of registered and beneficial shareholders, as well as the number of
employee shareholders in the Nordstrom 401(k) Plan and Profit Sharing Plan. On this date we had 218,020,643 shares of common stock outstanding.
The high and low sales prices of our common stock and dividends declared for each quarter of 2009 and 2008 are presented in the table below:
Common Stock Price
2009 2008 Dividends per Share
High Low High Low 2009 2008
1st Quarter $23.17 $11.19 $40.59 $30.72 $0.16 $0.16
2nd Quarter $26.70 $18.15 $38.65 $25.67 $0.16 $0.16
3rd Quarter $36.52 $26.25 $37.00 $13.66 $0.16 $0.16
4th Quarter $39.01 $31.32 $18.17 $6.61 $0.16 $0.16
Full Year $39.01 $11.19 $40.59 $6.61 $0.64 $0.64
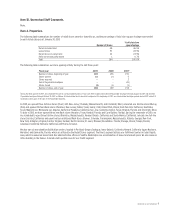
STOCK PRICE PERFORMANCE
The following graph compares, for each of the last five fiscal years ending January 30, 2010, the cumulative total return of Nordstrom, Inc. common
stock, Standard & Poor’s Retail Index and Standard & Poor’s 500 Index. The Retail Index is comprised of 30 retail companies, including Nordstrom, Inc.,
representing an industry group of the Standard & Poor’s 500 Index. The cumulative total return of Nordstrom, Inc. common stock assumes $100
invested on January 29, 2005 in Nordstrom, Inc. common stock and assumes reinvestment of dividends.
End of fiscal year: 2004 2005 2006 2007 2008 2009
Nordstrom, Inc. common stock 100 179 243 172 56 158
Standard & Poor’s Retail Index 100 108 123 99 61 93
Standard & Poor’s 500 Index 100 110 124 119 71 92
PERFORMANCE GRAPH
0
100
200
300
1/29/05 1/28/06 2/3/07 2/2/08 1/31/09 1/30/10
Year Ended
Dollars
Nordstrom, Inc. Common Stock
Standard & Poor's Retail Index
Standard & Poor's 500 Index