Nordstrom 2009 Annual Report Download - page 61
Download and view the complete annual report
Please find page 61 of the 2009 Nordstrom annual report below. You can navigate through the pages in the report by either clicking on the pages listed below, or by using the keyword search tool below to find specific information within the annual report.-
 1
1 -
2
-
3
-
4
-
5
-
6
-
7
-
8
-
9
-
10
-
11
-
12
-
13
-
14
-
15
-
16
-
17
-
18
-
19
-
20
-
21
-
22
-
23
-
24
-
25
-
26
-
27
-
28
-
29
-
30
-
31
-
32
-
33
-
34
-
35
-
36
-
37
-
38
-
39
-
40
-
41
-
42
-
43
-
44
-
45
-
46
-
47
-
48
-
49
-
50
-
 51
51 -
 52
52 -
 53
53 -
 54
54 -
 55
55 -
 56
56 -
 57
57 -
 58
58 -
 59
59 -
 60
60 -
 61
61 -
 62
62 -
 63
63 -
 64
64 -
 65
65 -
 66
66 -
 67
67 -
 68
68 -
 69
69 -
 70
70 -
 71
71 -
72
-
73
-
74
-
75
-
76
-
77
-
78
-
79
-
80
-
81
-
82
-
83
-
84
 |
 |

Nordstrom, Inc. and subsidiaries 53
Nordstrom, Inc.
Notes to Consolidated Financial Statements
Dollar and share amounts in millions except per share, per option and unit amounts
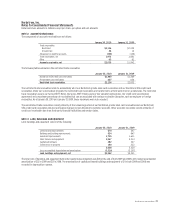
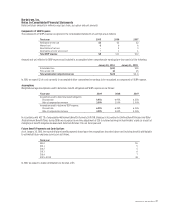
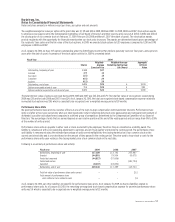
The weighted average fair value per option at the grant date was $7, $15 and $20 in 2009, 2008 and 2007. In 2009, 2008 and 2007, stock option awards
to employees were approved by the Compensation Committee of our Board of Directors and their exercise price was set at $13.47, $38.02 and $53.63,
the closing price of our common stock on February 27, 2009, February 28, 2008 and March 1, 2007 (the dates of grant). The stock option awards
provide recipients with the opportunity for financial rewards when our stock price increases. The awards are determined based upon a percentage of
the recipients’ base salary and the fair value of the stock options. In 2009, we awarded stock options to 1,213 employees compared to 1,230 and 1,195
employees in 2008 and 2007.
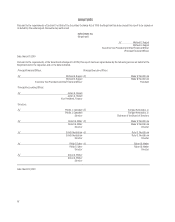
As of January 30, 2010, we have 14.5 options outstanding under the 2004 Equity Incentive Plan. Options generally vest over four years, and expire ten
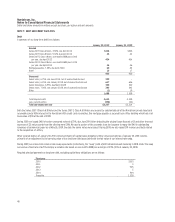
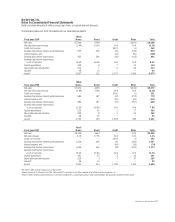
years after the date of grant. A summary of the stock option activity for 2009 is presented below:
Fiscal Year 2009
Shares
Weighted-
Average
Exercise Price
Weighted-Average
Remaining Contractual
Life (Years)
Aggregate
Intrinsic
Value
Outstanding, beginning of year 11.8 $27
Granted 4.9 13
Exercised (1.5) 14
Cancelled (0.5) 29
Expired (0.2) 20
Outstanding, end of year 14.5 $24
6 $193
Options exercisable at end of year 7.3 $25
4 $93
Options vested or expected to vest at end of year 13.5 $24
6 $180
The total intrinsic value of options exercised during 2009, 2008 and 2007 was $23, $14 and $79. The total fair value of stock options vested during
2009 was $25 and for both 2008 and 2007 it was $24. As of January 30, 2010, the total unrecognized stock-based compensation expense related to
nonvested stock options was $38, which is expected to be recognized over a weighted average period of 29 months.
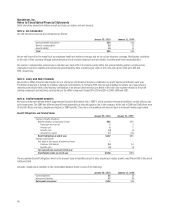
Performance Share Units
We grant performance share units to executive officers as one of the ways to align compensation with shareholder interests. Performance share
units vest after a three-year period only when our total shareholder return (reflecting daily stock price appreciation and compound reinvestment of
dividends) is positive and outperforms companies in a defined group of competitors determined by the Compensation Committee of our Board of
Directors. The percentage of units that are earned depends on our relative position at the end of the vesting period and can range from 0% to 125%
of the number of units granted.
Performance share units are payable in either cash or stock as elected by the employee; therefore they are classified as a liability award. The
liability is remeasured, with a corresponding adjustment to earnings, at each fiscal quarter-end during the vesting period. The performance share
unit liability is remeasured using the estimated percentage of units earned multiplied by the closing market price of our common stock on the
current period-end date and is pro-rated based on the amount of time passed in the vesting period. The price used to issue stock or cash for the
performance share units upon vesting is the closing market price of our common stock on the vest date.
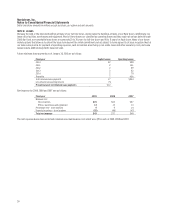
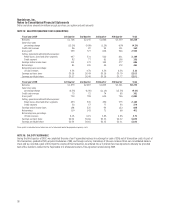
Following is a summary of performance share unit activity:
Fiscal year 2009 2008 2007
Outstanding, beginning of year 117,389 113,743 255,467
Granted 144,891 79,504 50,070
Vested but unearned (44,827) (57,006) -
Vested and earned - - (191,794)
Cancelled (8,007) (18,852) -
Outstanding, end of year 209,446 117,389 113,743
Total fair value of performance share units earned - - $12
Total amount of performance share
units settled or to be settled in cash - - $3
As of January 30, 2010, our other liabilities included $3 for performance share units. As of January 31, 2009, we had no liabilities related to
performance share units. As of January 30, 2010, the remaining unrecognized stock-based compensation expense for unvested performance share
units was $4, which is expected to be recognized over a weighted average period of 22 months.