Nordstrom 2009 Annual Report Download - page 30
Download and view the complete annual report
Please find page 30 of the 2009 Nordstrom annual report below. You can navigate through the pages in the report by either clicking on the pages listed below, or by using the keyword search tool below to find specific information within the annual report.-
 1
1 -
2
-
3
-
4
-
5
-
6
-
7
-
8
-
9
-
10
-
11
-
12
-
13
-
14
-
15
-
16
-
17
-
18
-
19
-
 20
20 -
 21
21 -
 22
22 -
 23
23 -
 24
24 -
 25
25 -
 26
26 -
 27
27 -
 28
28 -
 29
29 -
 30
30 -
 31
31 -
 32
32 -
 33
33 -
 34
34 -
 35
35 -
 36
36 -
 37
37 -
 38
38 -
 39
39 -
 40
40 -
41
-
42
-
43
-
44
-
45
-
46
-
47
-
48
-
49
-
50
-
51
-
52
-
53
-
54
-
55
-
56
-
57
-
58
-
59
-
60
-
61
-
62
-
63
-
64
-
65
-
66
-
67
-
68
-
69
-
70
-
71
-
72
-
73
-
74
-
75
-
76
-
77
-
78
-
79
-
80
-
81
-
82
-
83
-
84
 |
 |

22
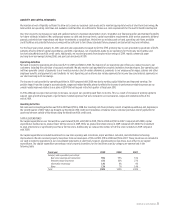
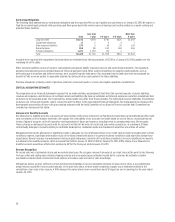
We anticipate that 2010 selling, general and administrative expenses for our Credit segment will decrease by $10 to $25, primarily due to lower bad debt
expense relative to 2009 as growth in the unemployment rate and growth in our associated write-offs slows down.
Total Company Results
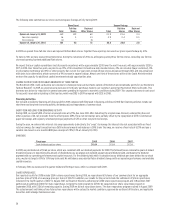
Interest Expense, Net
Fiscal year 2009 2008 2007
Interest expense, net $138 $131 $74
Interest expense, net increased $7 in 2009 compared with 2008 due to higher average debt levels resulting from the $400 debt offering in the second
quarter of 2009, partially offset by the $250 senior notes which matured in January 2009 and the impact of declining variable interest rates.
Interest expense, net increased $57 in 2008 compared with 2007 due to higher average debt levels resulting from the $1,000 debt offering in the fourth
quarter of 2007, as well as the $850 securitization transaction in May 2007.
We anticipate interest expense, net to decrease by $15 to $25 in 2010 due to lower debt levels, reductions in interest rates and lower borrowing
facility fees.
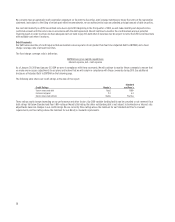
Income Tax Expense
Fiscal year 2009 2008 2007
Income tax expense $255 $247 $458
Effective tax rate 36.6% 38.1% 39.0%
The increase in our income tax expense in 2009 compared with 2008 was driven by the increase in our earnings before income taxes, while the decline
in income tax expense in 2008 compared with 2007 correlated with the decline in earnings before income taxes.
The following table illustrates the components of our effective tax rate for 2009, 2008 and 2007:
Fiscal year 2009 2008 2007
Statutory rate 35.0% 35.0% 35.0%
State and local income taxes, net of federal
income taxes 3.5 3.4 3.4
Deferred tax adjustment (1.8) (3.2) -
Permanent differences (0.6) 2.0 -
Other, net 0.5 0.9 0.6
Effective tax rate 36.6% 38.1% 39.0%
In 2009 and 2008, our effective tax rate was impacted by adjustments related to our deferred tax assets primarily driven by the closure of several tax
years under audit, as well as permanent items related to investment valuation. These adjustments reduced our effective tax rate by 2.4% and 1.2% in
2009 and 2008, respectively.
We anticipate our effective tax rate to be approximately 39.0% in 2010.
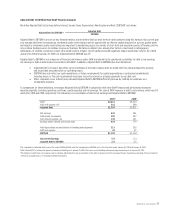
Net Earnings and Earnings per Diluted Share
Fiscal year 2009 2008 2007
Net earnings $441 $401 $715
Net earnings as a percentage of total revenues 5.1% 4.7% 7.9%
Earnings per diluted share $2.01 $1.83 $2.88
In 2009, net earnings increased 9.9% and earnings per diluted share increased $0.18 primarily as a result of improved gross profit and continued
expense performance, partially offset by increased performance-related expenses related to our strong operating results relative to our plan and
increased bad debt expense.
In 2008, net earnings decreased 43.9% and earnings per diluted share decreased 36.5% as a result of lower sales volume, increased markdowns and
higher bad debt expense, partially offset by decreased variable costs and reductions in fixed expenses. The decline in earnings per share was also
partially offset by the impact of share repurchases, which caused our weighted average shares outstanding to decrease in 2008 compared with 2007.
We expect our earnings per diluted share to be in the range of $2.35 to $2.55 in 2010.