Nordstrom 2009 Annual Report Download - page 26
Download and view the complete annual report
Please find page 26 of the 2009 Nordstrom annual report below. You can navigate through the pages in the report by either clicking on the pages listed below, or by using the keyword search tool below to find specific information within the annual report.-
 1
1 -
2
-
3
-
4
-
5
-
6
-
7
-
8
-
9
-
10
-
11
-
12
-
13
-
14
-
15
-
 16
16 -
 17
17 -
 18
18 -
 19
19 -
 20
20 -
 21
21 -
 22
22 -
 23
23 -
 24
24 -
 25
25 -
 26
26 -
 27
27 -
 28
28 -
 29
29 -
 30
30 -
 31
31 -
 32
32 -
 33
33 -
 34
34 -
 35
35 -
 36
36 -
37
-
38
-
39
-
40
-
41
-
42
-
43
-
44
-
45
-
46
-
47
-
48
-
49
-
50
-
51
-
52
-
53
-
54
-
55
-
56
-
57
-
58
-
59
-
60
-
61
-
62
-
63
-
64
-
65
-
66
-
67
-
68
-
69
-
70
-
71
-
72
-
73
-
74
-
75
-
76
-
77
-
78
-
79
-
80
-
81
-
82
-
83
-
84
 |
 |

18
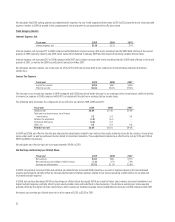
Direct net sales increased 8.4% in 2008, driven by our efforts to better align our merchandise offering and experience with our full-line stores. Our new
“Buy Online, Pick Up in Store” service was launched in 2008 and proved to be a convenient and valued service for our customers. The accessories,
women’s apparel and kids’ merchandise categories led the growth in our Direct sales in 2008.
Rack same-store sales increased 3.1% for the year in 2008. The accessories category, led by designer handbags, and men’s apparel category, led by
premium denim, drove this growth. All regions contributed to the positive same-store sales results.
During 2008 we opened eight full-line and six Rack stores. These stores represented 3.3% of our total net sales for fiscal 2008, and increased our gross
square footage by 6.7% during 2008.
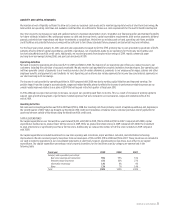
SAME-STORE SALES OUTLOOK – 2010
We expect 2010 same-store sales to increase approximately 2% to 4%. The same-store sales increase in the first half of 2010 is expected to be
approximately 300 basis points higher than in the second half of 2010.
As of March 19, 2010, we have opened three Rack stores. In total, we plan to open three full-line stores, relocate one full-line store and open fourteen
additional Rack stores during the remainder of 2010. This will increase retail square footage by approximately 4.5%.
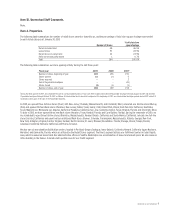
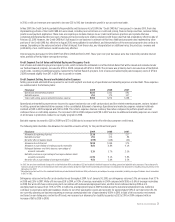
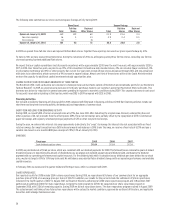
Retail Business Gross Profit
Fiscal year 2009 2008 2007
Gross profit1 $2,985 $2,905 $3,349
Gross profit rate2 36.1% 35.1% 37.9%
Average inventory per square foot $43.96 $49.00 $52.70
Inventory turnover rate3 5.41 5.20 5.16
1Gross profit is calculated as net sales less Retail Business cost of sales and related buying and occupancy costs.
2Gross profit rate is calculated as gross profit divided by net sales.
3Inventory turnover rate is calculated as annual cost of sales and related buying and occupancy costs (for all segments) divided by 4-quarter average inventory.
GROSS PROFIT – 2009 VS 2008
Retail gross profit increased $80 from last year while our gross profit rate improved 101 basis points compared with the same period in 2008. Retail
gross profit consists of merchandise margin offset by buying and occupancy costs. The improvement for the year was driven by overall improvement in
our merchandise margin, particularly in the second half of the year. The latter half of 2008 was highly promotional among retailers, meaning many
competitors took steep markdowns and/or offered special events or incentives to attract customers, as sales declined. We were able to be less
promotional and reduce markdowns during 2009, particularly during the second half of the year, by aligning inventory with sales trends. All major
merchandise categories at our full-line stores contributed to this improvement over 2008. The improvement in our merchandise margin was offset by
an increase in our buying and occupancy costs. Buying and occupancy costs as a percentage of sales increased 51 basis points. This increase was
primarily driven by incentives that were a result of strong company performance relative to our plans for 2009.
Our inventory turnover rate increased 4.0% over last year while our average inventory per square foot decreased 10.3%. Our merchandising efforts
have enabled us to manage inventory levels consistent with sales trends and maintain fresh merchandise in our stores. Combined with the increased
sell-through resulting from our improved multi-channel inventory capabilities, these efforts led to a significant increase in our inventory turnover rate.
GROSS PROFIT – 2008 VS 2007
Retail gross profit in 2008 decreased $444 from 2007 while our gross profit rate declined 280 basis points. The deterioration in 2008 was driven
primarily by a decrease in our merchandise margin rate as we utilized markdowns to respond to slower sales and a more promotional environment.
All major merchandise categories at our full-line stores contributed to this decrease. Our buying and occupancy costs as a percentage of sales
increased 76 basis points as many of these costs were fixed relative to the sales decline.
Our inventory turnover rate improved slightly in 2008 while our average inventory per square foot decreased 7.0%. Our merchants’ efforts to align
inventory levels to lower demand resulted in the improvement in our inventory turnover rate and our lower inventory per square foot. Our objective
was to match the change in inventory per square foot, which declined 7.0% on average, with our same-store sales rate, which declined 9.0% for
the year.
GROSS PROFIT OUTLOOK – 2010
In 2010, we expect a 20 to 60 basis point improvement in our total company gross profit rate, which includes both our Retail gross profit and our cost of
loyalty points within our Credit segment. We expect greater improvement in the first half of the year when compared to 2009, when weaker sales trends in
the first and second quarters increased markdown pressure. The improvement will be partially offset by additional occupancy expense for the three new
full-line and seventeen new Rack stores in 2010.
Retailers do not uniformly record the costs of buying and occupancy and supply chain operations (freight, purchasing, receiving, distribution, etc.) between
gross profit and selling, general and administrative expense. As such, our gross profit and selling, general and administrative expenses and rates may not
be comparable to other retailers’ expenses and rates.