Nordstrom 2009 Annual Report Download - page 33
Download and view the complete annual report
Please find page 33 of the 2009 Nordstrom annual report below. You can navigate through the pages in the report by either clicking on the pages listed below, or by using the keyword search tool below to find specific information within the annual report.-
 1
1 -
2
-
3
-
4
-
5
-
6
-
7
-
8
-
9
-
10
-
11
-
12
-
13
-
14
-
15
-
16
-
17
-
18
-
19
-
20
-
21
-
22
-
 23
23 -
 24
24 -
 25
25 -
 26
26 -
 27
27 -
 28
28 -
 29
29 -
 30
30 -
 31
31 -
 32
32 -
 33
33 -
 34
34 -
 35
35 -
 36
36 -
 37
37 -
 38
38 -
 39
39 -
 40
40 -
 41
41 -
 42
42 -
 43
43 -
44
-
45
-
46
-
47
-
48
-
49
-
50
-
51
-
52
-
53
-
54
-
55
-
56
-
57
-
58
-
59
-
60
-
61
-
62
-
63
-
64
-
65
-
66
-
67
-
68
-
69
-
70
-
71
-
72
-
73
-
74
-
75
-
76
-
77
-
78
-
79
-
80
-
81
-
82
-
83
-
84
 |
 |

Nordstrom, Inc. and subsidiaries 25
LIQUIDITY AND CAPITAL RESOURCES
We maintain a level of liquidity sufficient to allow us to cover our seasonal cash needs and to maintain appropriate levels of short-term borrowings. We
believe that our operating cash flows and available credit facilities are sufficient to finance our cash requirements for the next 12 months and beyond.
Over the long term, we manage our cash and capital structure to maximize shareholder return, strengthen our financial position and maintain flexibility
for future strategic initiatives. We continuously assess our debt and leverage levels, capital expenditure requirements, debt service payments, dividend
payouts, potential share repurchases and future investments or acquisitions. We believe our existing cash on-hand, operating cash flows, available
credit facilities and potential future borrowings will be sufficient to fund these scheduled future payments and potential long-term initiatives.
For the fiscal year ended January 30, 2010, cash and cash equivalents increased by $723 to $795, primarily due to cash provided by operations of $1,251,
partially offset by $360 of capital expenditures; and $182 of purchases, net of payments, made by our customers for third-party merchandise and
services using Nordstrom VISA credit cards. Additionally, we received proceeds from long-term borrowings of $399, repaid commercial paper
and long-term borrowings totaling $300, and paid cash dividends of $139.
Operating Activities
Net cash provided by operating activities was $1,251 in 2009 and $848 in 2008. The majority of our operating cash inflows are related to sales to our
customers, including the collection of accounts receivable. We also receive cash payments for property incentives from developers. Our operating cash
outflows generally consist of payments to our inventory vendors (net of vendor allowances), payments to our employees for wages, salaries and other
employee benefits, and payments to our landlords for rent. Operating cash outflows also include payments for income taxes and interest payments on
our short and long-term borrowings.
The increase in cash provided by operating activities in 2009 compared with 2008 was due to working capital initiatives and improved earnings. The
positive impact from the change in accrued salaries, wages and related benefits primarily reflects the increase in performance-related expenses as our
overall results improved relative to our plans in 2009 that will be paid in the first quarter of fiscal year 2010.
In 2010, although we expect net earnings to increase, we expect our operating cash flows to decline. This is a result of increases in working capital to
support sales growth and payment of performance-related expenses that were included in accrued salaries, wages and related benefits at the
end of 2009.
Investing Activities
Net cash used in investing activities was $541 in 2009 and $792 in 2008. Our investing cash flows primarily consist of capital expenditures and, beginning in
the second quarter of 2007 (when we brought our Nordstrom VISA credit card receivables on-balance sheet), customer purchases (net of payments) for
goods and services outside of Nordstrom using the Nordstrom VISA credit cards.
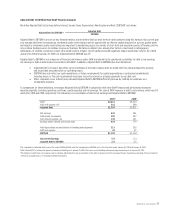
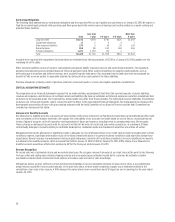
CAPITAL EXPENDITURES
Our capital expenditures over the last three years totaled $1,424, with $360 in 2009, $563 in 2008 and $501 in 2007. Compared with 2008, capital
expenditures declined as we opened fewer full-line stores in 2009. While we opened more Rack stores in 2009 compared with 2008, the investment
to open a Rack store is significantly less than a full-line store. Additionally, we reduced the number of full-line store remodels in 2009 compared
with 2008.
Our capital expenditures included investments in new store openings and relocations, major and minor remodels, and information technology
improvements. We also received property incentives from our developers of $96 in 2009, $119 in 2008 and $58 in 2007. These incentives are included in
our cash provided by operations in our consolidated statements of cash flows, however operationally we view these as an offset to our capital
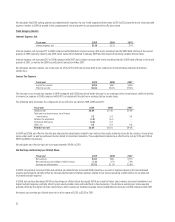
expenditures. Our capital expenditure percentage, net of property incentives, for the last three years by category are summarized in the
following table:
Fiscal year 2009 2008 2007
Category and expenditure percentage:
New store openings and relocations 59% 55% 51%
Remodels (major and minor) 15% 30% 27%
Information technology 13% 8% 8%
Other 13% 7% 14%
Total 100% 100% 100%