Nordstrom 2009 Annual Report Download - page 27
Download and view the complete annual report
Please find page 27 of the 2009 Nordstrom annual report below. You can navigate through the pages in the report by either clicking on the pages listed below, or by using the keyword search tool below to find specific information within the annual report.-
 1
1 -
2
-
3
-
4
-
5
-
6
-
7
-
8
-
9
-
10
-
11
-
12
-
13
-
14
-
15
-
16
-
 17
17 -
 18
18 -
 19
19 -
 20
20 -
 21
21 -
 22
22 -
 23
23 -
 24
24 -
 25
25 -
 26
26 -
 27
27 -
 28
28 -
 29
29 -
 30
30 -
 31
31 -
 32
32 -
 33
33 -
 34
34 -
 35
35 -
 36
36 -
 37
37 -
38
-
39
-
40
-
41
-
42
-
43
-
44
-
45
-
46
-
47
-
48
-
49
-
50
-
51
-
52
-
53
-
54
-
55
-
56
-
57
-
58
-
59
-
60
-
61
-
62
-
63
-
64
-
65
-
66
-
67
-
68
-
69
-
70
-
71
-
72
-
73
-
74
-
75
-
76
-
77
-
78
-
79
-
80
-
81
-
82
-
83
-
84
 |
 |

Nordstrom, Inc. and subsidiaries 19
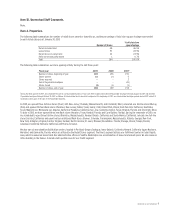
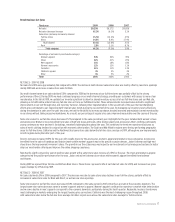
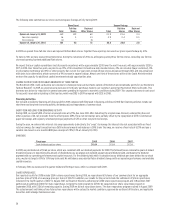
Retail Business Selling, General and Administrative Expenses
Fiscal year 2009 2008 2007
Selling, general and administrative expenses $2,109 $2,103 $2,161
Selling, general and administrative rate1 25.5% 25.4% 24.5%
1Selling, general and administrative rate is calculated as selling, general and administrative expenses for our Retail Business as a percentage of net sales.
SELLING, GENERAL AND ADMINISTRATIVE EXPENSES – 2009 VS 2008
Our Retail Business selling, general and administrative expenses (“Retail SG&A”) increased $6 due to increased performance-related incentives,
partially offset by lower variable expenses and cost savings resulting from controlling our fixed costs. We increased our provision for
performance-related expense as the year progressed to reflect the improved performance of our overall business relative to our plan. This reflects our
‘pay for performance’ approach to compensation. Our variable expenses decreased in conjunction with lower sales volume, and we worked diligently to
maintain our discipline in managing fixed costs. During 2009, we opened three full-line stores and thirteen Rack stores, which contributed $41 of
additional expenses. Although we opened more stores compared to 2008, the majority were Rack stores, which incur lower expenses than a full-line
store. These drivers led our Retail SG&A expenses as a percentage of net sales to be approximately flat versus last year.
SELLING, GENERAL AND ADMINISTRATIVE EXPENSES – 2008 VS 2007
Our SG&A expenses for our Retail Business decreased $58 due to lower variable expenses as well as cost savings resulting from our focus on controlling
fixed expenses, partially offset by the additional expenses related to our new stores. During 2008, we opened eight full-line stores and six Rack stores,
which contributed $72 of additional expenses. Our Retail SG&A expenses as a percentage of net sales increased 94 basis points. The increase as a
percentage of net sales was due to the fixed nature of many of our selling, general and administrative expenses and the impact of declining sales.
SELLING, GENERAL AND ADMINISTRATIVE EXPENSES OUTLOOK – 2010
In 2010, our Retail SG&A dollars are expected to increase $125 to $175, while our Retail SG&A expenses as a percentage of net sales will decrease 10 to 20
basis points. The majority of this increase relates to our expectations for increased variable expenses consistent with the planned increase in sales, as
well as approximately $50 to $60 of additional selling, general and administrative expenses from new stores to be opened during 2010.
Gain on Sale of Façonnable
During the third quarter of 2007, we completed the sale of the Façonnable business in exchange for cash of $216, net of transaction costs, and realized
a gain on sale of $34. The impact to reported earnings per diluted share for 2007 was $0.09, net of tax of $13.