Nordstrom 2009 Annual Report Download - page 25
Download and view the complete annual report
Please find page 25 of the 2009 Nordstrom annual report below. You can navigate through the pages in the report by either clicking on the pages listed below, or by using the keyword search tool below to find specific information within the annual report.-
 1
1 -
2
-
3
-
4
-
5
-
6
-
7
-
8
-
9
-
10
-
11
-
12
-
13
-
14
-
 15
15 -
 16
16 -
 17
17 -
 18
18 -
 19
19 -
 20
20 -
 21
21 -
 22
22 -
 23
23 -
 24
24 -
 25
25 -
 26
26 -
 27
27 -
 28
28 -
 29
29 -
 30
30 -
 31
31 -
 32
32 -
 33
33 -
 34
34 -
 35
35 -
36
-
37
-
38
-
39
-
40
-
41
-
42
-
43
-
44
-
45
-
46
-
47
-
48
-
49
-
50
-
51
-
52
-
53
-
54
-
55
-
56
-
57
-
58
-
59
-
60
-
61
-
62
-
63
-
64
-
65
-
66
-
67
-
68
-
69
-
70
-
71
-
72
-
73
-
74
-
75
-
76
-
77
-
78
-
79
-
80
-
81
-
82
-
83
-
84
 |
 |

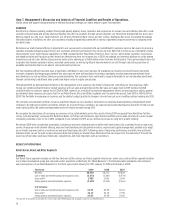
Nordstrom, Inc. and subsidiaries 17
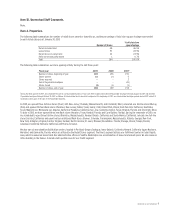
Retail Business Net Sales
Fiscal year 2009 2008 2007
Net sales $8,258
$8,272 $8,828
Net sales (decrease) increase
(0.2%) (6.3%) 3.1%
Same-store (decrease) increase by channel:
Full-line stores (7.2%) (12.4%) 2.5%
Direct 14.5%
8.4% 17.9%
Multi-channel (5.0%) (10.6%) 3.5%
Rack 2.5% 3.1% 8.7%
Total company (4.2%) (9.0%) 3.9%
Percentage of net sales by merchandise category:
Women’s apparel 34% 34% 35%
Shoes 22% 21% 20%
Men’s apparel 15% 16% 18%
Women’s accessories 12% 12% 11%
Cosmetics 11% 11% 11%
Children’s apparel 3% 3% 3%
Other 3% 3% 2%
Total 100% 100% 100%
NET SALES – 2009 VS 2008
Net sales for 2009 were approximately flat compared to 2008. The decline in multi-channel same-store sales was mostly offset by new store openings
during 2009 and an increase in same-store sales for Rack.
Our multi-channel same-store sales declined 5.0% compared to 2008 as the decrease at our full-line stores was partially offset by the strong
performance of Direct. During 2009, we made continued progress on our multi-channel strategy, providing our customers with access to more of our
merchandise. In the fall of 2009, we updated our inventory platform to allow for shared inventory across all of our full-line stores and our Web site,
allowing us to fulfill online orders from any full-line store or from our fulfillment center. These enhancements increased sales and led to significant
improvements in our sell-through rates and inventory turnover, following their implementation in the second half of the year. Our merchandising
efforts also contributed to our improving multi-channel sales trends during the second half of the year. By managing our inventory levels effectively
during the downturn in sales over the past two years, we had the flexibility to increase purchases as sales improved and maintain current merchandise
in our stores without taking excessive markdowns. As a result, our percentage of regular price sales improved measurably over the course of the year.
Same-store sales for our full-line stores decreased 7.2% compared to the same period last year. Highlights for the year included both women’s shoes
and accessories. Women’s shoes benefited from sales of high-end shoes and boots, while fashion jewelry led accessories. Men’s clothing, particularly
young contemporary wear and men’s furnishings, remained challenging throughout the year. This continues the trend we experienced last year as
sales of men’s clothing declined in conjunction with economic deterioration. The South and Mid-Atlantic regions were the top performing geographic
areas for full-line stores. California and the Northwest had same-store sales below the full-line store average in 2009, although we saw improvements
in both regions during the latter part of the year.
Direct’s net sales increased 14.5% for the year, with results driven by the accessories, women’s apparel and women’s shoes categories. Accessories
benefited from the sales of handbags and fashion jewelry while women’s apparel was led by special occasion dresses. Junior footwear and high-end
shoes drove the improvement in women’s shoes. The growth in our Direct business was helped by our investments in technology and systems to better
align our merchandise offering and improve the online shopping experience.
Rack had its eighth consecutive year of positive sales growth with a same-store sales increase of 2.5% for the year. The shoes and women’s apparel
categories led the positive performance for the year. Junior and active footwear drove shoes while women’s apparel benefited from knitwear
and blouses.
During 2009 we opened three full-line and thirteen Rack stores. These stores represent 2.6% of our total net sales for 2009, and increased our gross
square footage by 4.1% during 2009.
NET SALES – 2008 VS 2007
Net sales declined 6.3% in 2008 compared to 2007. The decrease was due to same-store sales declines in our full-line stores, partially offset by
increases in same-store sales for Rack and Direct, as well as new store openings.
Same-store sales for our full-line stores decreased 12.4% compared to the same period in 2007 primarily as a result of the economic downturn. The
largest same-store sales decreases came in women’s apparel and men’s apparel. Women’s apparel continued to experience a market-wide deterioration
and we saw a decline in men’s apparel correspond to the economic downturn, particularly during the fourth quarter. Regionally, business trends were
most challenging in markets undergoing the largest housing price corrections. California was the most challenging region throughout 2008,
with same-store sales below the full-line store average. All other regions were above the same-store sales average for full-line stores.