Nordstrom 2009 Annual Report Download - page 62
Download and view the complete annual report
Please find page 62 of the 2009 Nordstrom annual report below. You can navigate through the pages in the report by either clicking on the pages listed below, or by using the keyword search tool below to find specific information within the annual report.-
 1
1 -
2
-
3
-
4
-
5
-
6
-
7
-
8
-
9
-
10
-
11
-
12
-
13
-
14
-
15
-
16
-
17
-
18
-
19
-
20
-
21
-
22
-
23
-
24
-
25
-
26
-
27
-
28
-
29
-
30
-
31
-
32
-
33
-
34
-
35
-
36
-
37
-
38
-
39
-
40
-
41
-
42
-
43
-
44
-
45
-
46
-
47
-
48
-
49
-
50
-
51
-
 52
52 -
 53
53 -
 54
54 -
 55
55 -
 56
56 -
 57
57 -
 58
58 -
 59
59 -
 60
60 -
 61
61 -
 62
62 -
 63
63 -
 64
64 -
 65
65 -
 66
66 -
 67
67 -
 68
68 -
 69
69 -
 70
70 -
 71
71 -
 72
72 -
73
-
74
-
75
-
76
-
77
-
78
-
79
-
80
-
81
-
82
-
83
-
84
 |
 |

54
Nordstrom, Inc.
Notes to Consolidated Financial Statements
Dollar and share amounts in millions except per share, per option and unit amounts
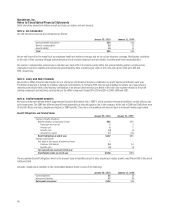
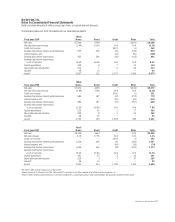
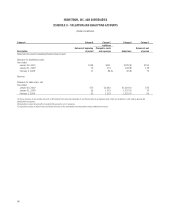
NOTE 12: INCOME TAXES
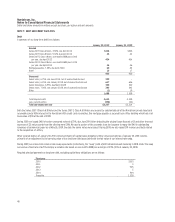
Income tax expense consists of the following:
Fiscal year 2009 2008 2007
Current income taxes:
Federal $275
$244
$435
State and local 38
39
65
Total current income tax expense 313 283 500
Deferred income taxes:
Current (28) (29) (24)
Non-current (30) (7) (18)
Total deferred income tax benefit (58) (36) (42)
Total income tax expense $255 $247 $458
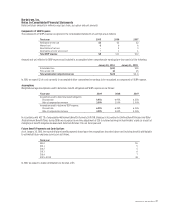
A reconciliation of the statutory Federal income tax rate to the effective tax rate on earnings before income taxes is as follows:
Fiscal year 2009 2008 2007
Statutory rate 35.0% 35.0% 35.0%
State and local income taxes, net of federal
income taxes 3.5 3.4 3.4
Deferred tax adjustment (1.8) (3.2) -
Permanent differences (0.6) 2.0 -
Other, net 0.5 0.9 0.6
Effective tax rate 36.6% 38.1% 39.0%
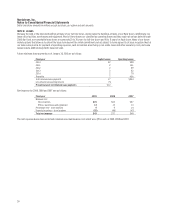
In 2009 and 2008, the IRS completed its routine examination of our federal filings for the 2007 and 2002 through 2006 years, respectively.
As a result of adjustments identified in the IRS examinations and revisions of estimates, we increased our deferred tax assets, which resulted
in a reduction in our effective tax rate in 2009 and 2008.
The major components of deferred tax assets and liabilities are as follows:
January 30, 2010 January 31, 2009
Compensation and benefits accruals $123 $99
Accrued expenses 67 63
Merchandise inventories 24 26
Land, buildings and equipment basis and
depreciation differences 13 7
Gift cards and gift certificates 18 17
Loyalty reward certificates 12 11
Allowance for doubtful accounts 74 54
Federal benefit of state taxes 11 10
Other 11 2
Total deferred tax assets 353 289
Total deferred tax liabilities – -
Net deferred tax assets $353 $289