Nordstrom 2009 Annual Report Download - page 28
Download and view the complete annual report
Please find page 28 of the 2009 Nordstrom annual report below. You can navigate through the pages in the report by either clicking on the pages listed below, or by using the keyword search tool below to find specific information within the annual report.-
 1
1 -
2
-
3
-
4
-
5
-
6
-
7
-
8
-
9
-
10
-
11
-
12
-
13
-
14
-
15
-
16
-
17
-
 18
18 -
 19
19 -
 20
20 -
 21
21 -
 22
22 -
 23
23 -
 24
24 -
 25
25 -
 26
26 -
 27
27 -
 28
28 -
 29
29 -
 30
30 -
 31
31 -
 32
32 -
 33
33 -
 34
34 -
 35
35 -
 36
36 -
 37
37 -
 38
38 -
39
-
40
-
41
-
42
-
43
-
44
-
45
-
46
-
47
-
48
-
49
-
50
-
51
-
52
-
53
-
54
-
55
-
56
-
57
-
58
-
59
-
60
-
61
-
62
-
63
-
64
-
65
-
66
-
67
-
68
-
69
-
70
-
71
-
72
-
73
-
74
-
75
-
76
-
77
-
78
-
79
-
80
-
81
-
82
-
83
-
84
 |
 |

20
Credit Segment
The Nordstrom credit card products are designed to strengthen customer relationships and grow retail sales by providing valuable services, loyalty
benefits and payment products. We believe that owning our credit card business allows us to fully integrate our rewards program with our retail stores
and provide better service to our customers, thus deepening our relationship with them and driving greater customer loyalty. Cardholders can
participate in the Nordstrom Fashion Rewards® program, through which customers accumulate points based on their level of spending (generally two
points per dollar spent at Nordstrom and one point per dollar spent outside of Nordstrom). Upon reaching two thousand points, customers receive
twenty dollars in Nordstrom Notes®, which can be redeemed for goods or services in our stores. As customers increase their level of spending they
receive additional benefits, including rewards such as complimentary shipping and alterations in our retail stores. Our cardholders tend to visit our
stores more frequently and spend more with us than non-cardholders. We believe the Fashion Rewards program, including these additional rewards,
helps drive sales in our Retail Stores and Direct segments.
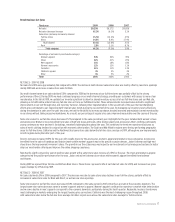
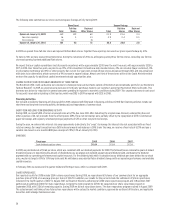
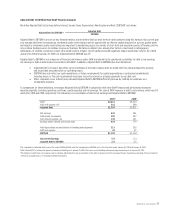
The table below illustrates a detailed view of the operational results of our Credit segment, consistent with the segment disclosure provided in the
notes to the consolidated financial statements. In order to view the economic contribution of our credit card program, the following items are also
included in the table below:
x Intercompany merchant fees
represent the estimated intercompany income of our credit business from the usage of our cards in the
Retail Stores and Direct segments. To encourage the use of Nordstrom cards in our stores, the Credit segment does not charge the Retail
Stores and Direct segments an intercompany interchange merchant fee. On a consolidated basis, we avoid costs that would be incurred if
our customers used third-party cards.
x During 2007, we combined our Nordstrom private label credit card and Nordstrom VISA credit card programs into one securitization
program. At that time the Nordstrom VISA credit card receivables were brought on-balance sheet. While the underlying economics of the
business did not change (Nordstrom has always owned 100% of its Credit segment), the accounting for this business segment did change.
For comparability between years, off-balance sheet income (expense), net (credit card revenues, net of bad debt and interest expense)
is shown for 2007.
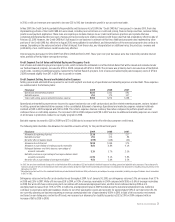
Interest expense is assigned to the Credit segment in proportion to the amount of estimated capital needed to fund our credit card receivables, which
assumes a mix of 80% debt and 20% equity. The average accounts receivable investment metric included in the following table represents our best
estimate of the amount of capital for our credit card program that is financed by equity. As a means of assigning a comparable cost of capital for our
credit card business, we believe it is important to maintain a capital structure similar to other financial institutions. Based on our research, debt as a
percentage of credit card receivables for other credit card companies ranges from 70% to 90%. We believe that debt equal to 80% of our credit card
receivables is appropriate given our overall capital structure goals.
Fiscal year 2009 2008 2007
Finance charge revenue $264
$215 $194
Interchange — third party 71 69 47
Late fees and other revenue 35 18 12
Total credit card revenues 370 302 253
Interest expense (41) (50) (64)
Net credit card income 329 252 189
Cost of sales and related buying and occupancy costs — loyalty program (55) (50) (47)
Selling, general and administrative expenses (356) (274) (198)
Total expense (411) (324) (245)
Earnings on investment in asset-backed securities, net - - 18
Credit segment loss before income taxes, as presented in segment
disclosure (82) (72) (38)
Intercompany merchant fees 50 48 48
Off-balance sheet income, net1 - - 9
Credit segment (loss) contribution, before income taxes ($32) ($24) $19
Average accounts receivable investment (assuming 80% of accounts
receivable is funded with debt) $420 $382 $332
Credit segment (loss) contribution, net of tax, as a percentage of average
accounts receivable investment (4.7%) (3.9%) 3.5%
1In 2007, this includes off-balance sheet finance charges and other income of $22, off-balance sheet interest expense of $6, and off-balance sheet bad debt expense of $7.
Net Credit Card Income
Credit card revenues include finance charges, interchange fees, late fees and other fees. Interchange fees are earned from the use of Nordstrom VISA
credit cards at merchants outside of Nordstrom.
Credit card revenues increased to $370 in 2009 compared with $302 in 2008 due to an increase in our annual percentage rate terms implemented in
the fourth quarter of 2008, growth in our accounts receivable balance and increased finance charges and late fees associated with increased
delinquencies during the economic downturn. The increase in credit card revenues from $253 in 2007 to $302 in 2008 was in part due to the Nordstrom
VISA portfolio being on-balance sheet for a full year in fiscal 2008 compared to only three quarters in fiscal 2007. The increase was also due to
portfolio growth and the change in our credit card pricing terms implemented in the fourth quarter of 2008, partially offset by a significant reduction in
the average prime rate.