Nordstrom 2009 Annual Report Download - page 31
Download and view the complete annual report
Please find page 31 of the 2009 Nordstrom annual report below. You can navigate through the pages in the report by either clicking on the pages listed below, or by using the keyword search tool below to find specific information within the annual report.-
 1
1 -
2
-
3
-
4
-
5
-
6
-
7
-
8
-
9
-
10
-
11
-
12
-
13
-
14
-
15
-
16
-
17
-
18
-
19
-
20
-
 21
21 -
 22
22 -
 23
23 -
 24
24 -
 25
25 -
 26
26 -
 27
27 -
 28
28 -
 29
29 -
 30
30 -
 31
31 -
 32
32 -
 33
33 -
 34
34 -
 35
35 -
 36
36 -
 37
37 -
 38
38 -
 39
39 -
 40
40 -
 41
41 -
42
-
43
-
44
-
45
-
46
-
47
-
48
-
49
-
50
-
51
-
52
-
53
-
54
-
55
-
56
-
57
-
58
-
59
-
60
-
61
-
62
-
63
-
64
-
65
-
66
-
67
-
68
-
69
-
70
-
71
-
72
-
73
-
74
-
75
-
76
-
77
-
78
-
79
-
80
-
81
-
82
-
83
-
84
 |
 |

Nordstrom, Inc. and subsidiaries 23
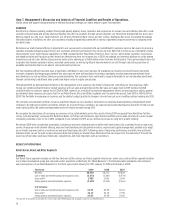
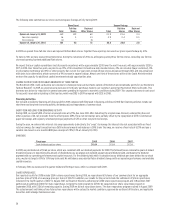
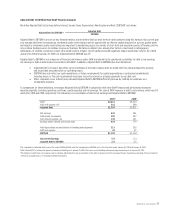
Fourth Quarter Results
Quarter Ended January 30, 2010 January 31, 2009
Net sales $2,539
$2,301
Cost of sales and related buying and occupancy costs (1,593) (1,565)
Gross profit 946
736
Selling, general and administrative expenses (737) (665)
Net earnings 172 68
Earnings per diluted share $0.77 $0.31
% of net sales:
Cost of sales and related buying and occupancy costs 62.7% 68.0%
Gross profit 37.3% 32.0%
Selling, general and administrative expenses 29.0% 28.9%
Our fourth quarter performance reflected continued improvement in our sales and gross margin trends that we experienced throughout the year,
particularly in the second half. Earnings per diluted share were $0.77 for the quarter ended January 30, 2010 compared to $0.31 for the quarter ended
January 31, 2009. Net earnings for the fourth quarter of 2009 were $172 compared with $68 in 2008.
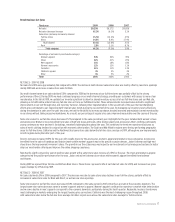
NET SALES
Total sales for the quarter increased 10.3% to $2,539 while same-store sales improved 6.9%. Multi-channel same-store sales increased 7.1%, with full-
line same-store sales increasing 3.9% and Direct sales increasing 32.1%. Our multi-channel results benefited this year from both the comparison to a
difficult period last year, as well as our shared inventory platform which enables online orders to be fulfilled from our full-line stores.
Results in full-line stores improved, as same-store sales increased 3.9% for the quarter. Our top performing categories were women’s better apparel,
women’s shoes, and accessories. Women’s better apparel benefited primarily from sweaters. Women’s shoes were led by high-end shoes and junior
shoes, while jewelry drove the increase in accessories. The Midwest, South and Northwest regions were the top performing geographic regions for
full-line stores relative to the fourth quarter of 2008.
Net sales for the Direct segment increased 32.1%, led by the performance of women’s shoes and apparel. Shoes was driven by junior shoes and
high-end footwear, while coats and dresses performed well in women’s apparel.
Rack same-store sales increased 4.6% for the fourth quarter. Shoes, driven by juniors and active footwear, and women’s clothing, driven by denim and
knit tops, were the leading categories for Rack.
GROSS PROFIT
Our gross profit rate increased 527 basis points to 37.3% from 32.0% last year. The improvement was mainly driven by merchandise margin as a
percentage of net sales, partially offset by the impact of higher performance-related expenses included in buying and occupancy. Markdowns improved
in the fourth quarter of 2009 when compared with the highly promotional fourth quarter experienced in 2008. We were effective in our management of
inventory and ended the year with an inventory turn of 5.4, the highest in recent company history. We also ended the quarter with inventory per square
foot down 4.1% from the fourth quarter of 2008.
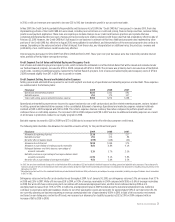
SELLING, GENERAL & ADMINISTRATIVE EXPENSES
Selling, general and administrative dollars for our Retail Business increased $56 compared to last year’s fourth quarter. The increase was largely driven
by increased performance-related expenses due to our strong performance relative to our plan and higher variable expenses as a result of the
improvement in sales. Our new store expenses in the fourth quarter of 2009 were $13, which partially offset fixed expense savings during the quarter.
These drivers contributed to the 11 basis point increase in Retail Business selling, general and administrative expenses.
In the fourth quarter, selling, general and administrative expenses for our credit segment were $106, up from $90 in 2008. A majority of the increase
was driven by higher bad debt expense from increased write-offs associated with higher unemployment.
For further information on our quarterly results in 2009 and 2008, refer to Note 15 in the Notes to Consolidated Financial Statements in Item 8.