Nordstrom 2009 Annual Report Download - page 44
Download and view the complete annual report
Please find page 44 of the 2009 Nordstrom annual report below. You can navigate through the pages in the report by either clicking on the pages listed below, or by using the keyword search tool below to find specific information within the annual report.-
 1
1 -
2
-
3
-
4
-
5
-
6
-
7
-
8
-
9
-
10
-
11
-
12
-
13
-
14
-
15
-
16
-
17
-
18
-
19
-
20
-
21
-
22
-
23
-
24
-
25
-
26
-
27
-
28
-
29
-
30
-
31
-
32
-
33
-
 34
34 -
 35
35 -
 36
36 -
 37
37 -
 38
38 -
 39
39 -
 40
40 -
 41
41 -
 42
42 -
 43
43 -
 44
44 -
 45
45 -
 46
46 -
 47
47 -
 48
48 -
 49
49 -
 50
50 -
 51
51 -
 52
52 -
 53
53 -
 54
54 -
55
-
56
-
57
-
58
-
59
-
60
-
61
-
62
-
63
-
64
-
65
-
66
-
67
-
68
-
69
-
70
-
71
-
72
-
73
-
74
-
75
-
76
-
77
-
78
-
79
-
80
-
81
-
82
-
83
-
84
 |
 |

36
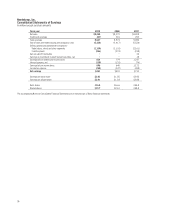
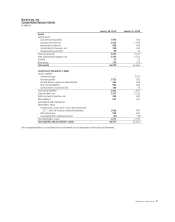
Nordstrom, Inc.
Consolidated Statements of Earnings
In millions except per share amounts
Fiscal year 2009 2008 2007
Net sales $8,258 $8,272 $8,828
Credit card revenues 369 301 252
Total revenues 8,627 8,573 9,080
Cost of sales and related buying and occupancy costs (5,328) (5,417) (5,526)
Selling, general and administrative expenses:
Retail stores, direct and other segments (2,109) (2,103) (2,161)
Credit segment (356) (274) (198)
Gain on sale of Façonnable – - 34
Earnings on investment in asset-backed securities, net – - 18
Earnings before interest and income taxes 834 779 1,247
Interest expense, net (138) (131) (74)
Earnings before income taxes 696 648 1,173
Income tax expense (255) (247) (458)
Net earnings $441 $401 $715
Earnings per basic share $2.03 $1.85 $2.92
Earnings per diluted share $2.01 $1.83 $2.88
Basic shares 216.8 216.6 244.8
Diluted shares 219.7 219.2 248.8
The accompanying Notes to Consolidated Financial Statements are an integral part of these financial statements.