Nordstrom 2009 Annual Report Download - page 34
Download and view the complete annual report
Please find page 34 of the 2009 Nordstrom annual report below. You can navigate through the pages in the report by either clicking on the pages listed below, or by using the keyword search tool below to find specific information within the annual report.-
 1
1 -
2
-
3
-
4
-
5
-
6
-
7
-
8
-
9
-
10
-
11
-
12
-
13
-
14
-
15
-
16
-
17
-
18
-
19
-
20
-
21
-
22
-
23
-
 24
24 -
 25
25 -
 26
26 -
 27
27 -
 28
28 -
 29
29 -
 30
30 -
 31
31 -
 32
32 -
 33
33 -
 34
34 -
 35
35 -
 36
36 -
 37
37 -
 38
38 -
 39
39 -
 40
40 -
 41
41 -
 42
42 -
 43
43 -
 44
44 -
45
-
46
-
47
-
48
-
49
-
50
-
51
-
52
-
53
-
54
-
55
-
56
-
57
-
58
-
59
-
60
-
61
-
62
-
63
-
64
-
65
-
66
-
67
-
68
-
69
-
70
-
71
-
72
-
73
-
74
-
75
-
76
-
77
-
78
-
79
-
80
-
81
-
82
-
83
-
84
 |
 |

26
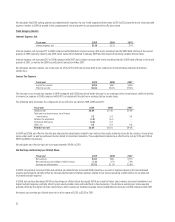
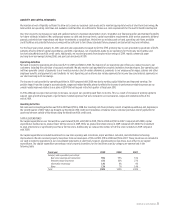
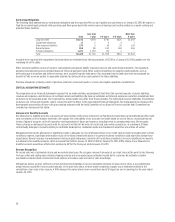
The following table summarizes our store count and square footage activity during 2009:
Store Count Square Footage
Full-line Rack and Full-line Rack and
Total Stores Other Stores Total Stores Other Stores
Balance at January 31, 2009 169 109 60 21.9 19.6 2.3
New store openings 16 3 13 0.9 0.4 0.5
Store closings (1) — (1) — — —
Balance at January 30, 2010 184 112 72 22.8 20.0 2.8
In 2009 we opened three full-line stores and opened thirteen Rack stores. Together these openings increased our gross square footage by 4.1%.
To date in 2010, we have opened three Rack stores. During the remainder of 2010, we anticipate opening three full-line stores, relocating one full-line
store and opening fourteen additional Rack stores.
We expect that our capital expenditures (net of property incentives) will be approximately $2,100 over the next five years, with approximately $325 to
$375 in 2010. Over these five years, we plan to use 37% of this investment to build new and relocated stores, 41% on remodels (major and minor), 11%
on information technology and 11% for other projects. Our current five-year plans include 28 new stores announced through 2012, and two announced
with dates to be determined, which represents a 9% increase in square footage. Almost one third of these stores will be in the South. We believe that
we have the capacity for additional capital investments should opportunities arise.
CHANGE IN CREDIT CARD RECEIVABLES ORIGINATED AT THIRD PARTIES
The Nordstrom VISA credit cards allow our customers to make purchases at merchants outside of Nordstrom and accumulate points for our Nordstrom
Fashion Rewards®. In 2009, we experienced a decrease in third party purchases made by our customers using their Nordstrom VISA credit cards. This
decrease was driven by reductions in general consumer spending in response to economic conditions during 2009. This caused a decrease in cash used
for accounts receivable originating at third parties, which was $182 in 2009 compared with $232 in 2008.
Financing Activities
Our net cash provided by financing activities was $13 in 2009 compared with $342 used in financing activities in 2008. Our financing activities include our
short-term and long-term borrowing activity, dividends paid, and repurchases of common stock.
SHORT-TERM AND LONG-TERM BORROWING ACTIVITY
During 2009, we issued $400 of senior unsecured notes at 6.75% due June 2014. After deducting the original issue discount, underwriting fees and
other expenses of $4, net proceeds from the offering were $396. These net borrowings were partially offset by the repayment of $275 in commercial
paper borrowings and regularly scheduled principal payments of $25 on other long term borrowings.
During the year, we entered into interest rate swap agreements (collectively, the “swap”) to manage the interest rate risk associated with our fixed-
rate borrowings. Our swap transaction has a $650 notional amount and matures in 2018. Under the swap, we receive a fixed rate of 6.25% and pay a
variable rate based on one month LIBOR plus a margin of 2.9% (3.1% at January 30, 2010).
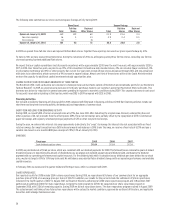
DIVIDENDS
Fiscal year 2009 2008 2007
Cash dividends paid per share $0.64 $0.64 $0.54
In 2009, we paid dividends of $0.64 per share, which was consistent with our dividend payments for 2008. This followed twelve consecutive years of annual
dividend increases. In determining the amount of dividends to pay, we analyze our dividend payout ratio and dividend yield, and balance the dividend
payment with our operating performance and capital resources. For the dividend yield, which is calculated as our dividends per share divided by our stock
price, we plan to target a 1.0% to 1.5% long-term yield. We will balance any potential future dividend changes with our operating performance and available
capital resources.
In February 2010, we declared a first quarter dividend of $0.16 per share, which is consistent with 2009.
SHARE REPURCHASES
Our reported results for 2008 include $264 in share repurchases. During 2008, we repurchased 6.9 shares of our common stock for an aggregate
purchase price of $238, at an average price per share of $34.29. In addition, our results for the period include the settlement of $26 in repurchases
initiated in the fourth quarter of 2007. In August 2007 our Board of Directors authorized a $1,500 share repurchase program and in November 2007
authorized an additional $1,000 for share repurchases, bringing the total program to $2,500. We suspended our share repurchase program in
September 2008, with $1,126 of remaining capacity. During 2009 we did not repurchase shares. The share repurchase program expired in August 2009.
The actual amount and timing of any future share repurchases will be subject to market conditions, approval by our Board of Directors, and applicable
Securities and Exchange Commission rules.