Nordstrom 2009 Annual Report Download - page 24
Download and view the complete annual report
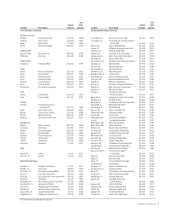
Please find page 24 of the 2009 Nordstrom annual report below. You can navigate through the pages in the report by either clicking on the pages listed below, or by using the keyword search tool below to find specific information within the annual report.-
 1
1 -
2
-
3
-
4
-
5
-
6
-
7
-
8
-
9
-
10
-
11
-
12
-
13
-
 14
14 -
 15
15 -
 16
16 -
 17
17 -
 18
18 -
 19
19 -
 20
20 -
 21
21 -
 22
22 -
 23
23 -
 24
24 -
 25
25 -
 26
26 -
 27
27 -
 28
28 -
 29
29 -
 30
30 -
 31
31 -
 32
32 -
 33
33 -
 34
34 -
35
-
36
-
37
-
38
-
39
-
40
-
41
-
42
-
43
-
44
-
45
-
46
-
47
-
48
-
49
-
50
-
51
-
52
-
53
-
54
-
55
-
56
-
57
-
58
-
59
-
60
-
61
-
62
-
63
-
64
-
65
-
66
-
67
-
68
-
69
-
70
-
71
-
72
-
73
-
74
-
75
-
76
-
77
-
78
-
79
-
80
-
81
-
82
-
83
-
84
 |
 |

16
Item 7. Management’s Discussion and Analysis of Financial Condition and Results of Operations.
(Dollar, share and square footage amounts in millions except percentages, per share and per square foot amounts)
OVERVIEW
Nordstrom is a fashion specialty retailer offering high-quality apparel, shoes, cosmetics and accessories for women, men and children. We offer a wide
selection of brand name and private label merchandise. We offer our products through various channels: our ‘Nordstrom’ branded full-line stores and
Web site (which we refer to as “multi-channel”), our off-price ‘Nordstrom Rack’ stores, and our ‘Jeffrey’ boutiques. Our stores are located throughout
the United States. In addition, we offer our customers a loyalty program associated with a variety of payment products and services, including credit
and debit cards.
We believe our multi-channel offering is important to our success and is consistent with our commitment to customer service. Our goal is to provide a
seamless integrated shopping experience to our customers whenever and however they choose to shop. With that in mind, we are continuing to make
improvements to our multi-channel capabilities. In 2008, we launched the “Buy Online, Pick Up in Store” service, which allows customers to purchase
merchandise online and then pick up their item(s) at a Nordstrom store on the same day. In 2009, we updated our inventory platform to create shared
inventory across all of our full-line stores and our online store, allowing us to fulfill online orders from any full-line store. These enhancements have led
to greater merchandise selections online, improved convenience, as well as significant improvements in our sell-through rates (the proportion of
available merchandise that we are able to sell) and inventory turnover.
Our merchandising efforts have also been a significant contributor to our recent success. By managing our inventory levels effectively during the
economic downturn that began approximately two years ago, we were well positioned to increase purchases as sales improved and maintain fresh
merchandise in our stores without taking excessive markdowns. Our customers have continued to respond favorably to our merchandise assortment,
thereby contributing to additional sales growth and higher rates of regular-priced sales.
Throughout 2009, we demonstrated discipline in the management of our expenses. Our model is focused on controlling our fixed expenses, while
flexing our variable and performance-related expenses with our sales and earnings results. Our sales per square foot in 2009 declined to $368,
consistent with our sales per square foot of $369 in 2004. However, as a result of our expense management efforts, we decreased our selling, general
and administrative expenses per square foot for our Retail Stores, Direct and Other segments over the same time period, from $100 in 2004 to $94 in
2009. This flexibility in managing our business and the ability to adjust quickly to changes in trends have put us in a healthy position heading into 2010.
The economic environment continues to have a significant impact on our customers. Consumers are cautious about spending, unemployment levels
continue to be high and economic uncertainty remains. As a result of these conditions, we experienced elevated delinquency and write-off rates on our
credit card portfolio. We expect unemployment levels will remain elevated during 2010.
We recognize the importance of increasing our presence in top retail markets across the country. During 2009 we opened three Nordstrom full-line
stores, relocated another, and opened 13 Nordstrom Racks. In 2010 we will continue to open full-line and Rack stores while returning to a more regular
remodeling schedule of five-to-six in 2010, compared to one remodel in 2009, as we continue to pursue our long-term growth strategy.
We entered 2009 with considerable uncertainty, including an economic downturn and a volatile retail environment. Our continued focus on improving
service through our multi-channel offering, improved merchandising and disciplined inventory, expense and capital management, enabled us to adapt
as our trends improved, and as a result we are well positioned going into 2010. Following a year of improving performance and with a more efficient
business model, we are focused on improving execution and growing our market share. We believe that our response to the adversity of the past two
years has left us better positioned financially, competitively, and most important, with our customers.
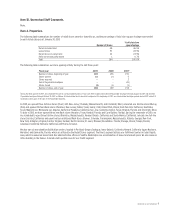
RESULTS OF OPERATIONS
Retail Stores, Direct and Other Segments
Summary
Our Retail Stores segment includes our full-line, Rack and Jeffrey stores; our Direct segment includes our online store; and our Other segment includes
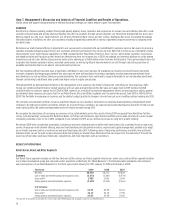
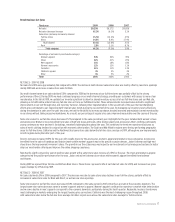
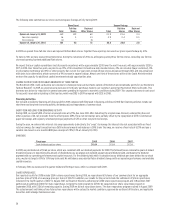
our product development group and corporate center operations (collectively the “Retail Business”). The following table summarizes the combined
sales and expenses of our Retail Business for the fiscal years ended January 30, 2010, January 31, 2009 and February 2, 2008:
Fiscal year 2009 2008 2007
Net sales $8,258
$8,272 $8,828
Cost of sales and related buying and occupancy costs (5,273) (5,367) (5,479)
Gross profit1 2,985
2,905 3,349
Selling, general and administrative expenses (2,109) (2,103) (2,161)
% of net sales:
Cost of sales and related buying and occupancy costs 63.9% 64.9% 62.1%
Gross profit 36.1% 35.1% 37.9%
Selling, general and administrative expenses 25.5% 25.4% 24.5%
1Gross profit is calculated as net sales less cost of sales and related buying and occupancy costs for our Retail Business.