Nordstrom 2009 Annual Report Download - page 60
Download and view the complete annual report
Please find page 60 of the 2009 Nordstrom annual report below. You can navigate through the pages in the report by either clicking on the pages listed below, or by using the keyword search tool below to find specific information within the annual report.-
 1
1 -
2
-
3
-
4
-
5
-
6
-
7
-
8
-
9
-
10
-
11
-
12
-
13
-
14
-
15
-
16
-
17
-
18
-
19
-
20
-
21
-
22
-
23
-
24
-
25
-
26
-
27
-
28
-
29
-
30
-
31
-
32
-
33
-
34
-
35
-
36
-
37
-
38
-
39
-
40
-
41
-
42
-
43
-
44
-
45
-
46
-
47
-
48
-
49
-
 50
50 -
 51
51 -
 52
52 -
 53
53 -
 54
54 -
 55
55 -
 56
56 -
 57
57 -
 58
58 -
 59
59 -
 60
60 -
 61
61 -
 62
62 -
 63
63 -
 64
64 -
 65
65 -
 66
66 -
 67
67 -
 68
68 -
 69
69 -
 70
70 -
71
-
72
-
73
-
74
-
75
-
76
-
77
-
78
-
79
-
80
-
81
-
82
-
83
-
84
 |
 |

52
Nordstrom, Inc.
Notes to Consolidated Financial Statements
Dollar and share amounts in millions except per share, per option and unit amounts
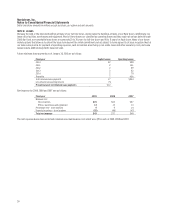
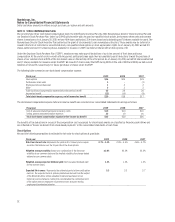
NOTE 11: STOCK COMPENSATION PLANS
We currently have three stock-based compensation plans: the 2004 Equity Incentive Plan, the 2002 Nonemployee Director Stock Incentive Plan and
our Employee Stock Purchase Plan. Under our 2004 Equity Incentive plan, we grant non-qualified stock options, performance share units and common
shares to employees. As of January 30, 2010, we have 48.4 shares authorized, 25.4 shares issued and outstanding and 7.8 shares available for grant. The
Nonemployee Director Stock Incentive Plan authorizes the grant of stock awards to our nonemployee directors. These awards may be deferred or
issued in the form of restricted or unrestricted stock, non-qualified stock options or stock appreciation rights. As of January 30, 2010, we had 0.9
shares authorized and 0.7 remaining shares available for issuance. In 2009, we deferred shares with a total expense of $1.
Under the Employee Stock Purchase Plan (“ESPP”), employees may make payroll deductions of up to ten percent of their base and bonus
compensation. At the end of each six-month offering period, participants may apply their accumulated payroll deductions toward the purchase of
shares of our common stock at 90% of the fair market value on the last day of the offer period. As of January 30, 2010, we had 9.4 shares authorized
and 1.7 shares available for issuance under the ESPP. We issued 0.7 shares under the ESPP during 2009. At the end of 2009 and 2008, we had current
liabilities of $4 and $5, respectively, for future purchases of shares under the ESPP.
The following table summarizes our stock-based compensation expense:
Fiscal year
2009 2008 2007
Stock options $26 $24 $23
Performance share units 3 - (1)
Employee stock purchase plan 1 2 2
Other 2 2 2
Total stock-based compensation expense before income tax benefit 32 28 26
Income tax benefit (12) (10) (9)
Total stock
-
based compensation expense, net of income tax benefit $20
$18 $17
The stock-based compensation expense before income tax benefit was recorded in our consolidated statements of earnings as follows:
Fiscal year
2009 2008 2007
Cost of sales and related buying and occupancy costs $10 $10 $10
Selling, general and administrative expenses 22 18 16
Total stock
-
based compensation expense before income tax benefit $32 $28 $26
The benefits of tax deductions in excess of the compensation cost recognized for stock-based awards are classified as financing cash inflows and
are reflected as “Excess tax benefit from stock-based payments” in the consolidated statements of cash flows.
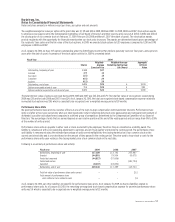
Stock Options
We used the following assumptions to estimate the fair value for stock options at grant date:
Fiscal year 2009 2008 2007
Risk-free interest rate: Represents the yield on U.S. Treasury zero-coupon
securities that mature over the 10-year life of the stock options.
0.7% – 3.3% 2.0% - 4.3% 4.6% - 4.7%
Weighted average volatility: Based on a combination of the historical
volatility of our common stock and the implied volatility of exchange traded
options for our common stock.
61.0% 45.0% 35.0%
Weighted average expected dividend yield: Our forecasted dividend yield
for the next ten years.
1.3% 1.3% 1.0%
Expected life in years: Represents the estimated period of time until option
exercise. The expected term of options granted was derived from the output
of the Binomial Lattice option valuation model and was based on our
historical exercise behavior, taking into consideration the contractual term
of the option and our employees’ expected exercise and post-vesting
employment termination behavior.
5.3
5.5
5.7