Nordstrom 2003 Annual Report Download - page 46
Download and view the complete annual report
Please find page 46 of the 2003 Nordstrom annual report below. You can navigate through the pages in the report by either clicking on the pages listed below, or by using the keyword search tool below to find specific information within the annual report.-
 1
1 -
2
-
3
-
4
-
5
-
6
-
7
-
8
-
9
-
10
-
11
-
12
-
13
-
14
-
15
-
16
-
17
-
18
-
19
-
20
-
21
-
22
-
23
-
24
-
25
-
26
-
27
-
28
-
29
-
30
-
31
-
32
-
33
-
34
-
35
-
 36
36 -
 37
37 -
 38
38 -
 39
39 -
 40
40 -
 41
41 -
 42
42 -
 43
43 -
 44
44 -
 45
45 -
 46
46 -
 47
47 -
 48
48 -
 49
49 -
 50
50 -
 51
51 -
 52
52 -
 53
53 -
 54
54 -
 55
55
 |
 |

NORDSTROM, INC. and SUBSIDIARIES
[44 ]
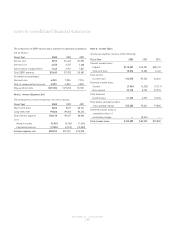
The following tables set forth the information for our reportable segments and a reconciliation to the consolidated totals:
Retail Credit Catalog/ Corporate
Fiscal Year 2003 Stores Operations Internet and Other Eliminations Total
Revenues from external customers (b) $6,199,023 — $292,650 — — $6,491,673
Service charge income — $142,773 — — — 142,773
Intersegment revenues 25,652 34,276 — — $(59,928) —
Interest expense, net 697 22,122 (105) $68,238 — 90,952
Depreciation and amortization 224,018 2,838 5,052 18,775 — 250,683
Earnings before taxes 582,737 17,473 8,625 (210,694) — 398,141
Net earnings (loss) 355,432 10,658 5,261 (128,510) — 242,841
Assets (a)(b) 2,686,927 878,541 93,070 807,150 — 4,465,688
Capital expenditures 242,331 1,104 4,729 10,150 — 258,314
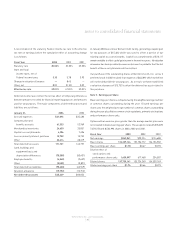
Retail Credit Catalog/ Corporate
Fiscal Year 2002 Stores Operations Internet and Other Eliminations Total
Revenues from external customers (b) $5,721,517 — $253,559 — — $5,975,076
Service charge income — $133,587 — — — 133,587
Intersegment revenues 29,737 32,783 — — $(62,520) —
Interest expense, net 191 23,582 972 $57,176 — 81,921
Depreciation and amortization 201,861 3,212 4,977 23,881 — 233,931
Earnings before taxes and cumulative effect
of accounting change 450,476 21,194 (21,926) (254,120) — 195,624
Net earnings (loss) 261,439 12,929 (13,375) (170,769) — 90,224
Assets (a)(b) 2,686,252 753,377 89,512 582,766 — 4,111,907
Capital expenditures 230,864 2,058 4,507 90,737 — 328,166
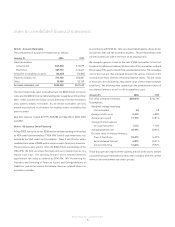
Retail Credit Catalog/ Corporate
Fiscal Year 2001 Stores Operations Internet and Other Eliminations Total
Revenues from external customers (b) $5,370,761 — $263,369 — — $5,634,130
Service charge income — $131,267 — — — 131,267
Intersegment revenues 20,192 25,514 — — $(45,706) —
Interest expense, net 994 25,013 77 $48,954 — 75,038
Depreciation and amortization 182,960 2,253 5,498 22,378 — 213,089
Amortization of intangible assets 4,630 — — — — 4,630
Earnings before taxes 402,313 10,652 (8,153) (200,324) — 204,488
Net earnings (loss) 245,313 6,495 (4,971) (122,149) — 124,688
Assets (a)(b) 2,570,375 699,454 69,457 720,964 — 4,060,250
Capital expenditures 379,819 2,054 2,554 11,621 — 396,048
(a) Segment assets in Corporate and Other include unallocated assets in corporate headquarters, consisting primarily of cash, land, buildings and
equipment, and deferred tax assets.
(b) Includes foreign sales of $92,524, $82,126 and $78,210 for the years ended January 31, 2004, 2003 and 2002, and assets of $234,459, $219,861
and $198,689 as of January 31, 2004, 2003 and 2002.
notes to consolidated financial statements