Nordstrom 2003 Annual Report Download - page 18
Download and view the complete annual report
Please find page 18 of the 2003 Nordstrom annual report below. You can navigate through the pages in the report by either clicking on the pages listed below, or by using the keyword search tool below to find specific information within the annual report.-
 1
1 -
2
-
3
-
4
-
5
-
6
-
7
-
 8
8 -
 9
9 -
 10
10 -
 11
11 -
 12
12 -
 13
13 -
 14
14 -
 15
15 -
 16
16 -
 17
17 -
 18
18 -
 19
19 -
 20
20 -
 21
21 -
 22
22 -
 23
23 -
 24
24 -
 25
25 -
 26
26 -
 27
27 -
 28
28 -
29
-
30
-
31
-
32
-
33
-
34
-
35
-
36
-
37
-
38
-
39
-
40
-
41
-
42
-
43
-
44
-
45
-
46
-
47
-
48
-
49
-
50
-
51
-
52
-
53
-
54
-
55
 |
 |

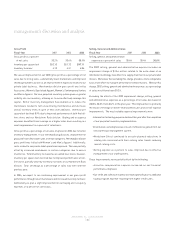
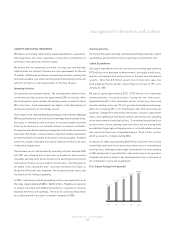
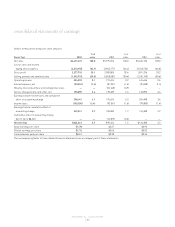
Gross Profit
Fiscal Year 2001 2002 2003
Gross profit as a percent
of net sales 33.2% 33.6% 35.1%
Inventory per square foot $52.10 $51.72 $47.11
Inventory turnover 4.10 4.31 4.54
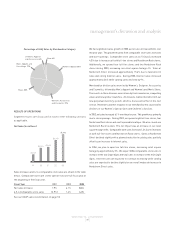
We saw an improvement in our 2003 gross profit as a percentage of net
sales due to strong sales, substantially lower markdowns and improved
shrinkage numbers as well as an improvement in expenses related to our
private label business. Merchandise division gross profit was led by
Accessories, Women's Specialized Apparel, Women’s Contemporary/Juniors
and Men's Apparel. Our new perpetual inventory system gives us greater
visibility into our inventory, allowing us to more effectively manage this
capital. Better inventory management has enabled us to reduce the
markdowns needed to turn slow-moving merchandise and decrease
overall inventory levels in spite of new store additions. Inventory per
square foot declined 8.9% due to improved performance at both the full-
line stores and our Nordstrom Rack division. Buying and occupancy
expenses benefited from leverage on a higher sales base resulting in a
small improvement on a percent of sales basis.
Gross profit as a percentage of net sales improved in 2002 due to better
inventory management. In our merchandising divisions, improvement in
gross profit rate offset lower sales in certain categories. Merchandise division
gross profit was led by both Women's and Men's Apparel. Additionally,
costs related to our private label operations improved. This was partially
offset by increased markdowns in certain categories due to excess
inventories. Total inventory increased as we added new stores, however,
inventory per square foot declined due to improved performance at full-
line stores partially offset by inventory increases at our Nordstrom Rack
division. Total shrinkage as a percentage of sales was even with the
previous year.
In 2004, we expect to see continuing improvement in our gross profit
performance through lower markdowns and increased inventory turnover.
Additionally we plan a slight improvement in our buying and occupancy
expenses on a percent of sales basis.
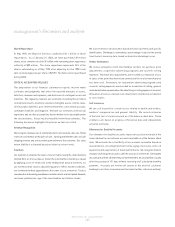
Selling, General and Administrative
Fiscal Year 2001 2002 2003
Selling, general and administrative
expense as a percent of sales 30.6% 30.4% 30.0%
The 2002 selling, general and administrative expense includes an
impairment charge of $15.6 million related to the write-down of an
information technology investment in a supply chain tool in our private label
division. We believe that excluding this charge provides a more comparable
basis from which to evaluate performance between years. Without this
charge, 2002 selling, general and administrative expenses as a percentage
of sales would have been 30.2%.
Excluding the effects of the 2002 impairment charge, selling, general
and administrative expenses as a percentage of net sales decreased in
2003 to 30.0% from 30.2% in the prior year. This improvement is primarily
the result of leverage on better-than-planned sales and overall expense
improvements. The most notable expense improvements were:
•Information technology expense declined this year after the completion
of our perpetual inventory implementation.
•Distribution costs improved as a result of efficiencies gained from our
new warehouse management system.
•Nordstrom Direct continued to execute planned reductions in
catalog size consistent with their catalog sales trends, reducing
overall catalog costs.
•Selling expense as a percent to sales improved due to effective
management of our staffing levels.
These improvements were partially offset by the following:
•Incentive compensation expense increased as our financial
performance improved.
•Our credit and collection expense increased primarily due to additional
loyalty program expense resulting from higher credit sales.
management’s discussion and analysis
NORDSTROM, INC. and SUBSIDIARIES
[16 ]