Nordstrom 2003 Annual Report Download - page 31
Download and view the complete annual report
Please find page 31 of the 2003 Nordstrom annual report below. You can navigate through the pages in the report by either clicking on the pages listed below, or by using the keyword search tool below to find specific information within the annual report.-
 1
1 -
2
-
3
-
4
-
5
-
6
-
7
-
8
-
9
-
10
-
11
-
12
-
13
-
14
-
15
-
16
-
17
-
18
-
19
-
20
-
 21
21 -
 22
22 -
 23
23 -
 24
24 -
 25
25 -
 26
26 -
 27
27 -
 28
28 -
 29
29 -
 30
30 -
 31
31 -
 32
32 -
 33
33 -
 34
34 -
 35
35 -
 36
36 -
 37
37 -
 38
38 -
 39
39 -
 40
40 -
 41
41 -
42
-
43
-
44
-
45
-
46
-
47
-
48
-
49
-
50
-
51
-
52
-
53
-
54
-
55
 |
 |

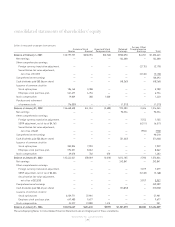
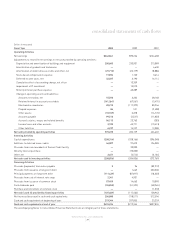
NORDSTROM, INC. and SUBSIDIARIES
[29 ]
Dollars in thousands
Fiscal Year 2003 2002 2001
Operating Activities
Net earnings $242,841 $90,224 $124,688
Adjustments to reconcile net earnings to net cash provided by operating activities:
Depreciation and amortization of buildings and equipment 250,683 233,931 213,089
Amortization of goodwill and tradename —— 4,630
Amortization of deferred lease credits and other, net (27,712) (22,179) (8,886)
Stock-based compensation expense 17,894 1,130 3,414
Deferred income taxes, net 32,027 6,190 16,114
Cumulative effect of accounting change, net of tax —13,359 —
Impairment of IT investment —15,570 —
Minority interest purchase expense —40,389 —
Change in operating assets and liabilities:
Accounts receivable, net 15,593 6,362 28,168
Retained interest in accounts receivable (141,264) (67,561) (5,475)
Merchandise inventories 28,213 (117,379) 80,246
Prepaid expenses 86 521 (2,438)
Other assets (10,109) 3,378 (16,770)
Accounts payable 99,516 (2,537) (11,850)
Accrued salaries, wages and related benefits 56,115 23,763 (203)
Income taxes and other accruals 3,105 43,771 (10,413)
Other liabilities 6,237 14,227 12,088
Net cash provided by operating activities 573,225 283,159 426,402
Investing Activities
Capital expenditures (258,314) (328,166) (396,048)
Additions to deferred lease credits 46,007 97,673 126,383
Proceeds from sale-leaseback of Denver Credit facility —20,000 —
Minority interest purchase —(70,000) —
Other, net 3,451 (3,513) (3,104)
Net cash used in investing activities (208,856) (284,006) (272,769)
Financing Activities
Proceeds (payments) from notes payable 396 (82,912)
Proceeds from issuance of long-term debt —1,665 300,000
Principal payments on long-term debt (111,439) (87,697) (18,640)
Proceeds from sale of interest rate swap 2,341 4,931 —
Proceeds from issuance of common stock 57,459 14,663 10,090
Cash dividends paid (55,853) (51,322) (48,265)
Purchase and retirement of common stock —— (1,310)
Net cash (used in) provided by financing activities (107,489) (117,664) 158,963
Net increase (decrease) in cash and cash equivalents 256,880 (118,511) 312,596
Cash and cash equivalents at beginning of year 219,344 337,855 25,259
Cash and cash equivalents at end of year $476,224 $219,344 $337,855
The accompanying Notes to Consolidated Financial Statements are an integral part of these statements.
consolidated statements of cash flows