Nordstrom 2003 Annual Report Download - page 2
Download and view the complete annual report
Please find page 2 of the 2003 Nordstrom annual report below. You can navigate through the pages in the report by either clicking on the pages listed below, or by using the keyword search tool below to find specific information within the annual report.-
 1
1 -
 2
2 -
 3
3 -
 4
4 -
 5
5 -
 6
6 -
 7
7 -
 8
8 -
 9
9 -
 10
10 -
 11
11 -
 12
12 -
 13
13 -
14
-
15
-
16
-
17
-
18
-
19
-
20
-
21
-
22
-
23
-
24
-
25
-
26
-
27
-
28
-
29
-
30
-
31
-
32
-
33
-
34
-
35
-
36
-
37
-
38
-
39
-
40
-
41
-
42
-
43
-
44
-
45
-
46
-
47
-
48
-
49
-
50
-
51
-
52
-
53
-
54
-
55
 |
 |

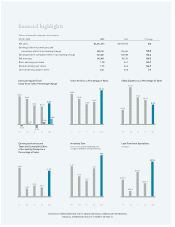
Dollars in thousands except per share amounts
FISCAL YEAR 2003 2002 % Change
Net sales $6,491,673 $5,975,076 8
8.6
Earnings before income taxes and
cumulative effect of accounting change 398,141 195,624 103.5
Earnings before cumulative effect of accounting change 242,841 103,583 134.4
Net earnings 242,841 90,224 169.2
Basic earnings per share 1.78 0.67 165.7
Diluted earnings per share 1.76 0.66 166.7
Cash dividends paid per share 0.41 0.38 7.9
Inventory Turn
(Cost of sales and related buying and
occupancy divided by average inventory)
Cash Flow from Operations
in millions
Earnings before Income
Taxes and Cumulative Effect
of Accounting Change as a
Percentage of Sales
6.4%
3.0%
3.6% 3.3%
6.1%
4.34
4.19
4.10
4.31
4.54
$369.2
$185.3
$426.4
$283.2
$573.2
financial highlights
Sales per Square Foot/
Comp-Store Sales Percentage Change
Gross Profit as a Percentage of Sales SG&A Expense as a Percentage of Sales
99 00 01 02 03
99 00 01 02 03
99 00 01 02 03 99 00 01 02 03 99 00 01 02 03
99 00 01 02 03
$350
-1.1%
0.3%
-2.9%
1.4%
4.3%
$342
$321 $319
$327
29.6%
31.6%
30.6%
30.4%
30.0%
34.8%
34.0%
33.2%
33.6%
35.1%
PLEASE VISIT WWW.NORDSTROM.COM TO OBTAIN ADDITIONAL SHAREHOLDER INFORMATION
FINANCIAL INFORMATION TABLE OF CONTENTS ON PAGE 13