Nordstrom 2003 Annual Report Download - page 39
Download and view the complete annual report
Please find page 39 of the 2003 Nordstrom annual report below. You can navigate through the pages in the report by either clicking on the pages listed below, or by using the keyword search tool below to find specific information within the annual report.-
 1
1 -
2
-
3
-
4
-
5
-
6
-
7
-
8
-
9
-
10
-
11
-
12
-
13
-
14
-
15
-
16
-
17
-
18
-
19
-
20
-
21
-
22
-
23
-
24
-
25
-
26
-
27
-
28
-
 29
29 -
 30
30 -
 31
31 -
 32
32 -
 33
33 -
 34
34 -
 35
35 -
 36
36 -
 37
37 -
 38
38 -
 39
39 -
 40
40 -
 41
41 -
 42
42 -
 43
43 -
 44
44 -
 45
45 -
 46
46 -
 47
47 -
 48
48 -
 49
49 -
50
-
51
-
52
-
53
-
54
-
55
 |
 |

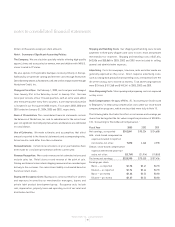
NORDSTROM, INC. and SUBSIDIARIES
[37 ]
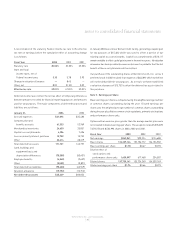
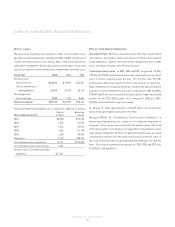
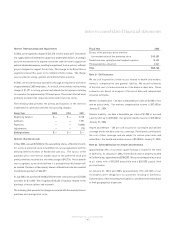
The following table illustrates the sensitivity in the fair market value
estimates of the retained interests given independent changes in
assumptions as of January 31, 2004:
+10% +20% -10% -20%
Gross Yield $1,594 $3,187 $(1,594) $(3,187)
Interest Expense on Issued
Classes (60) (121) 60 121
Card Holders Payment Rate (532) (842) 537 1,264
Charge Offs (539) (1,077) 541 1,084
Discount Rate (411) (821) 412 825
These sensitivities are hypothetical and should be used with caution. The
effect of an adverse change in a particular assumption on the fair value
of the retained interest is calculated without changing any other assumption.
In reality, changes in one factor may result in changes in another, which
might alter the reported sensitivities.
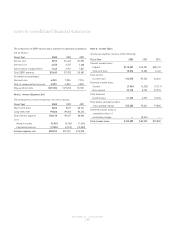
The following table summarizes certain income, expenses and cash flows
received from and paid to the master note trust.
Fiscal Year 2003 2002 2001
Principal collections reinvested in
new receivables $1,332,790 $824,715 $669,582
Gains on sales of receivables 4,920 8,290 3,147
Income earned on retained interests 31,926 10,786 6,711
Cash flows from retained assets:
Retained interests 58,222 28,100 11,916
Servicing fees 7,631 5,407 8,440
Interest income earned on the retained interests is included in service charge
income and other on the consolidated statements of earnings.
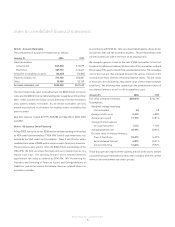
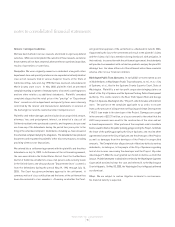
The total principal balance of the VISA receivables was $465,198 and
$323,101 as of January 31, 2004 and 2003. Gross credit losses were
$22,393, $18,580 and $17,050 for the years ended January 31, 2004, 2003
and 2002, and receivables past due for more than 30 days were $8,805 and
$8,519 at January 31, 2004 and 2003.
The following table illustrates default projections using net credit losses
as a percentage of average outstanding receivables in comparison to
actual performance:
Fiscal Year 2004 2003 2002
Original projection 5.59% 6.16% 7.66%
Actual N/A 5.57% 6.59%
Under the terms of the trust agreement, we may be required to fund
certain amounts upon the occurrence of specific events. The securitization
agreements set a maximum percentage of receivables that can be
associated with employee accounts. As of January 31, 2004, this maximum
was exceeded by $1,595. In addition, other excess concentrations total
$186. It is possible that we may be required to repurchase these receivables.
Aside from these instances, we do not believe any additional funding will
be required.
Our continued involvement in the securitization of VISA receivables will
include recording gains/losses on sales in accordance with SFAS No. 140
and recognizing income on retained assets as prescribed by EITF 99-20
"Recognition of Interest Income and Impairment on Purchased and
Retained Beneficial Interests in Securitized Financial Assets," holding
subordinated, non-subordinated and residual interests in the trust, and
servicing the portfolio.
notes to consolidated financial statements