NetFlix 2004 Annual Report Download - page 65
Download and view the complete annual report
Please find page 65 of the 2004 NetFlix annual report below. You can navigate through the pages in the report by either clicking on the pages listed below, or by using the keyword search tool below to find specific information within the annual report.-
 1
1 -
2
-
3
-
4
-
5
-
6
-
7
-
8
-
9
-
10
-
11
-
12
-
13
-
14
-
15
-
16
-
17
-
18
-
19
-
20
-
21
-
22
-
23
-
24
-
25
-
26
-
27
-
28
-
29
-
30
-
31
-
32
-
33
-
34
-
35
-
36
-
37
-
38
-
39
-
40
-
41
-
42
-
43
-
44
-
45
-
46
-
47
-
48
-
49
-
50
-
51
-
52
-
53
-
54
-
 55
55 -
 56
56 -
 57
57 -
 58
58 -
 59
59 -
 60
60 -
 61
61 -
 62
62 -
 63
63 -
 64
64 -
 65
65 -
 66
66 -
 67
67 -
 68
68 -
 69
69 -
 70
70 -
 71
71 -
 72
72 -
 73
73 -
 74
74 -
 75
75 -
76
-
77
-
78
-
79
-
80
-
81
-
82
-
83
-
84
-
85
-
86
-
87
-
88
-
89
-
90
-
91
-
92
-
93
-
94
-
95
 |
 |

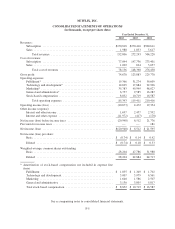
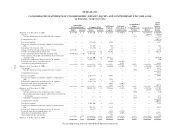
NETFLIX, INC.
CONSOLIDATED STATEMENTS OF OPERATIONS
(in thousands, except per share data)
Year Ended December 31,
2002 2003 2004
Revenues:
Subscription ................................................ $150,818 $270,410 $500,611
Sales ...................................................... 1,988 1,833 5,617
Totalrevenues .......................................... 152,806 272,243 506,228
Cost of revenues:
Subscription ................................................ 77,044 147,736 273,401
Sales ...................................................... 1,092 624 3,057
Totalcostofrevenues .................................... 78,136 148,360 276,458
Gross profit 74,670 123,883 229,770
Operating expenses:
Fulfillment* ................................................ 19,366 31,274 56,609
Technology and development* ................................. 14,625 17,884 22,906
Marketing* ................................................. 35,783 49,949 98,027
General and administrative* ................................... 6,737 9,585 16,287
Stock-based compensation ..................................... 8,832 10,719 16,587
Total operating expenses .................................. 85,343 119,411 210,416
Operating income (loss) ........................................... (10,673) 4,472 19,354
Other income (expense):
Interest and other income ...................................... 1,697 2,457 2,592
Interest and other expense ..................................... (11,972) (417) (170)
Netincome(loss)beforeincometaxes ............................... (20,948) 6,512 21,776
Provision for income taxes ......................................... — — 181
Netincome(loss) ................................................ $(20,948) $ 6,512 $ 21,595
Net income (loss) per share:
Basic ...................................................... $ (0.74) $ 0.14 $ 0.42
Diluted .................................................... $ (0.74) $ 0.10 $ 0.33
Weighted-average common shares outstanding:
Basic ...................................................... 28,204 47,786 51,988
Diluted .................................................... 28,204 62,884 64,713
* Amortization of stock-based compensation not included in expense line
items:
Fulfillment ................................................. $ 1,055 $ 1,349 $ 1,702
Technology and development .................................. 3,007 3,979 6,561
Marketing .................................................. 1,640 1,586 2,507
General and administrative .................................... 3,130 3,805 5,817
Total stock-based compensation ................................ $ 8,832 $ 10,719 $ 16,587
See accompanying notes to consolidated financial statements.
F-5